EP301: Will Greenzilla Destroy the Earth?
The Facts Behind Global Warming
David Noel
<davidn@aoi.com.au>
Ben Franklin Centre for Theoretical Research
PO Box 27, Subiaco, WA 6008, Australia.
Beginning somewhere around 1980, an amazing fallacy has overtaken the human race, easily the greatest in human history.
This fallacy is that the Earth is warming up because of increasing levels of carbon dioxide in the atmosphere, carbon dioxide due to man-made activity. Dubbed 'The Greenhouse Effect', a myth has been perpetuated of an all-devouring monster taking over the Earth's climate, a monster which I have nicknamed 'Greenzilla'.
According to the current misconception, Greenzilla is leading us to disaster, causing an unstoppable warming of the atmosphere, rising sea levels leading to drowning of low-lying countries, increasingly destructive cyclones and storms, a threat to the existence of polar bears, destruction of coral reefs, spread of tropical diseases into temperate areas, loss of native plant and animal species, and on and on and on.
This is not just an amusing myth to be smiled at occasionally. Governments and others are spending literally billions of dollars and years of research effort to appease the Greenzilla monster, money and effort totally wasted. Money and effort which could be used instead to genuinely benefit the planet.
What this is all about
This article examines the root mechanisms underlying the so-called Greenhouse Effect, and shows that this 'Effect' fails testing by simple laws of physics, and is a myth. It also demonstrates that Global Warming, a real occurrence in recent years, is just part of natural cycles and has nothing to do with levels of carbon dioxide or other 'Greenhouse Gases' in the atmosphere.
This article also examines where we are today in the warming/ cooling cycle, and estimates when the current warming trend will reverse. It also suggests a possible trigger for this reversal.
The Great Global Warming Swindle
A major advance in the rational examination of the 'Greenhouse Effect' and Global Warming occurred with the 2007 release by Channel 4 in the United Kingdom of the Martin Durkin documentary, The Great Global Warming Swindle [1].
The documentary demonstrated how a widespread fallacy or misbelief can arise and be perpetuated by the action of forces and pressures at three different levels:
Level One. Scientific and Logical Analysis and Testing;
Level Two. Commercial and Sociological Imperatives; and
Level Three. Philosophical and Religious Beliefs.
But first, a useful quote to bear in mind through what follows:
Quotation Q1
Level One. Scientific and Logical Analysis and Testing
A great deal of scientific evidence showing that warming is not due to man-made carbon dioxide is given in 'The Great Global Warming Swindle' [1], and more is given below.
However, the way of the world is such that straight science and logic do not sway entrenched opinion even in the scientific community, let alone where the general public is concerned.
Scientists working 'professionally' on Level One are still members of the wider community, and straight, cool use of Level One analysis often gives way to pressures from Levels Two and Three. Members of the general public do not have access to the data and tools of Level One, and so rely on the pronouncements of 'experts' from these levels. This perpetuates established ideas.
Quotation Q2
Level Two. Commercial and Sociological Imperatives
Outcomes in Level Two are subject to what might be called the 'Commercial Imperative', that is, Money Talks. Or maybe, Money Decides.
Quotation Q3
The good news is that the Commercial Imperative can change, that is, if commercial interests can see a monetary advantage in a changed way at looking at a situation, that change is more likely to find acceptance.
Level Three. Philosophical and Religious Beliefs
Some of the scientists and observers who gave evidence in the 'Swindle' [1], including the founder of Greenpeace, believed that the 'Green Movement' had been hijacked by activists working on covert agendas, and that 'Greenhouse Gas Warming' had taken on many of the aspects of a religion.
At Level Three, actions and outcomes are often determined by faith, rather than money or logic, to which faith may be impervious.
The 'Greenhouse Effect'
The idea behind the Greenhouse Effect is simple, even if its use as a model of factors in Earth's atmosphere is appallingly wrong.
In a conventional plant greenhouse, heat enters the greenhouse from the Sun's rays passing through the glass or plastic roof, or from a stove, or heated air pumped into the greenhouse. The heated air seeks to rise by simple thermal convection ("hot air rises").
The hot air holds heat through motion of its molecules. This is quite different to the heat in incoming solar rays, which are infrared and light rays, forms of electromagnetic radiation. The hot air is physically restrained from rising by the roof of the greenhouse, and so the heat is kept in.
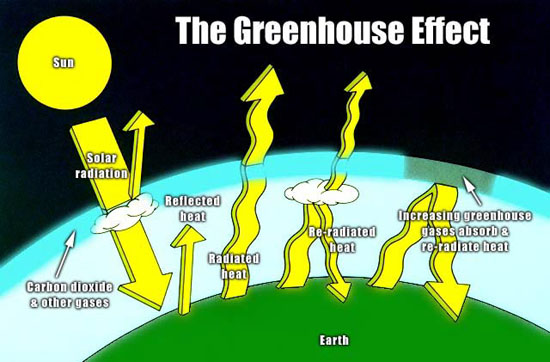
Figure 1. The Greenhouse Effect. From [2].
On the right of this illustration is a representation of how 'greenhouse gases' are supposed to enhance global warming. They are shown as accumulating in a layer towards the top of the atmosphere, where they 'reflect back' rising heat toward the surface.
Of course this is only a graphic representation of a supposed phenomenon, but it completely lacks any real physical basis. The 'greenhouse gases', in whatever form, are only gas molecules, and can't physically restrain rising hot air.
Nor can they 'reflect back' radiation. In the early days of the Greenhouse Effect fallacy, a physicist I knew slightly was promoting the idea. I phoned him up and asked how the Effect worked. He told me that the gas layer absorbed heat radiation coming up from the surface and preferentially re-radiated it back down.
I asked him how the molecules were able to do this, but he had no answer. It is, of course, quite possible for a gas molecule to absorb radiation, and re-radiate it, possibly at a different wavelength, but it has no way to do this in a preferential direction. Instead it would pass on the heat packets in all directions, including out to space.
Even supposing the 'gas layer' had some magical way of reflecting the radiation downwards, it wouldn't make any difference. This is electromagnetic radiation, travelling at 300,000 km per second. If the 'gas layer' was at a height of 30 km, the radiation would be up and back 10,000 times per second, and the slightest percentage leakage, or the fall-off in radiation on nightfall, would soon let everything out.
There are two real effects, to do with cloud cover and with thermal conductivity of gases, which are sometimes confused with the 'Greenhouse Effect'. These will be looked at later.
But the 'Greenhouse Effect' itself is a total misconception which just not stand up against application of the simplest physical laws, a complete fallacy. In Hans Christian Andersen terms, the Emperor Has No Clothes.
Naked Emperor Decision Point 1.
Carbon dioxide levels in history
Carbon dioxide levels in the Earth's atmosphere have certainly varied hugely in the near and remote past. There is solid data to show that these levels have increased some 50% over the last 150 years, paralleling man's increasing use of fossil fuels and clearing of forests.
And there is evidence of a connection between carbon dioxide levels and average surface temperatures, stretching back several hundred thousand years.
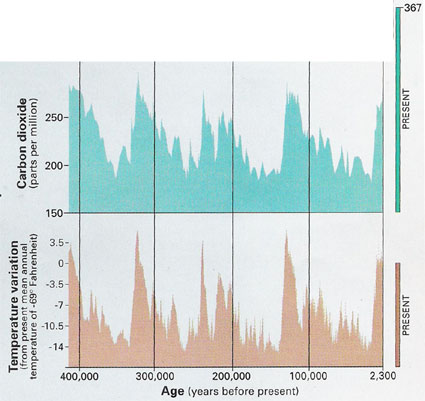
Figure 2. Temperature and carbon dioxide levels. From [3].
Figure 2 illustrates the connection, peaks and falls in temperature are associated with peaks and falls in carbon dioxide levels. But, as pointed out in [1], the carbon dioxide peaks lag behind the temperature peaks by about 800 years, so the temperature changes can't be caused by CO2.
In fact, rising temperatures somehow cause a rise in atmospheric CO2 content. The likely causes are that rising sea temperatures reduce the solubility of CO2 dissolved in the sea (normal for gases dissolved in liquids), and that higher temperatures mean that old plant material decays more rapidly.
The 'Swindle' program [1] was aired on ABC TV in Australia in 2007, and the presentation was followed by an Australian Forum in which it was discussed by a panel including a few 'climate experts'. One of these was Prof David Karoly, who made two claims, which lead to an interesting question:
Quotation GRQ4
Of course, the answer to the question is 'No'. This simple observation in itself eliminates any idea that rising C02 levels cause rising temperatures.
Heat balance in the Earth
Local and average temperatures in the Earth's atmosphere, at its land and sea surfaces, and below these land and sea surfaces, are continuously changing according to dynamic balances between heat input and output.
These inputs and outputs are subject to major variations on a daily basis, as the Earth turns different faces to the Sun, and on a yearly basis, as the Earth's axial tilt exposes different areas preferentially to the Sun, causing the seasons.
There are also many other longer-term cycles. A useful reference is Michael Goodfellow's webpage, Global Warming: Our Story So Far, at [4], from which comes the following extract:
The Earth and Sun are moving through the galaxy, exposed to different environments as the solar system orbits the galactic core, over a period of 225-250 million years. The eccentricity of the Earth's orbit (difference from a perfect circle) changes over a 100,000 year period.
The tilt of the Earth on its axis varies over 41,000 years, from 21.5 degrees to 24.5 degrees. The axis of the Earth changes direction over 26,000 years. All of these change the amount of sunlight received, and the timing of the seasons.
The output of the Sun itself varies. On an 11-year "Schwabe Cycle", the number of sunspots varies. They also vary over longer periods, a 75-90-year "Gleissberg Cycle," a 200-500-year "Suess Cycle" and a 1,100-1,500-year "Bond Cycle."
But like any body in space, the Earth has built-in heat adjustment mechanisms. As well as receiving heat, the Earth also radiates heat, from all its surfaces. If the average heat input rises by a tiny amount, temperatures will rise slightly, sometimes over a long period, and the amount of heat radiated off will also rise a little.
This of course rules out one the most alarmist Warming claims, that the Earth could suffer a 'Runaway Greenhouse Effect" where warming factors build up on themselves and get out of control, such as has been claimed for the planet Venus.
Let's look now at some of the most important short-term heat factors.
Day and Night, Tropics and Poles
The most immediate factor we notice, as far as weather is concerned, is the alternation of night and day. The next most immediate factor is our latitude, where we are between the equator and one of the poles.
The Sun's heat is felt most strongly at midday in the tropics. It is at its least within one of the polar circles at midnight. All the many and complex matters we call weather and climate are largely dependent on the Earth's mechanisms to re-distribute the tropical daytime heat over the rest of the surface, moving heat from the tropics towards the poles.
Of the three mechanisms of heat transfer -- conduction, convection, and radiation -- the one we notice most is convection within the atmosphere. This is the movement of heat by physical transfer of currents of fluid matter, what we call winds.
On the larger scale, these winds will include cyclones, jet streams, and the like. These heat transfer processes occur mostly over times of days to weeks.
Longer-term processes are dependent on seasonal changes and on the sorts of radiation cycles noted previously. Many of them depend on convectional movements, not in the atmosphere, but in the oceans. They typically occur over periods of years to centuries, and are vital in some of the matters to follow.
Anyone wanting to know more about the detailed facts of weather and climate and their changes over time should consult William Kininmonth's book Climate Change: A Natural Hazard [5].
Climate Change: A Natural Hazard
Input from the Sun and Albedo
By far the biggest item of heat input to Earth is solar radiation. Depending on their reflectivity or 'albedo', planets may immediately slough off much of this radiation by reflection.
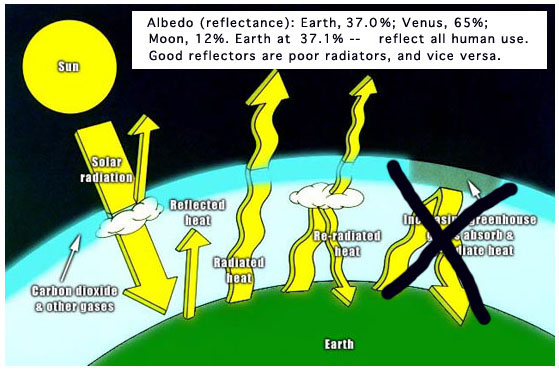
Figure 3. Albedo and reflection of Sun's rays
Earth's albedo is around 0.37 or 37%, that is, over a third of solar radiation striking the planet is immediately reflected off into space. Most of this is from clouds. Glaciers and ocean surfaces are also important. Because cloud cover varies considerably according to weather conditions, the precise value of the albedo is always changing.
The planet Venus, which is perpetually wreathed in thick clouds and has an atmosphere 90 times as dense as ours, mostly carbon dioxide, has a very high albedo of around 65%. Our Moon, with no atmosphere, seas, or clouds, and showing a rocky surface everywhere, has a low albedo, around 12% [6].
The energy which the Earth receives from the Sun each day is enormously greater than mankind's energy production. In my web article The HydroSolar Package [7], I show that the Sun sends us more than 10,000 times as much energy as we use -- including our direct use of solar energy.
The flip side of this is that if the Earth's albedo increased by one-tenth of one percent, perhaps by a small increase in cloud coverage, this would easily reflect off much more than the total energy we generate.
This in itself points up that all Man's energy activities are quite insignificant in the face of natural climatic processes. Efforts to reduce Global Warming by cutting down our energy use are laughable.
As well as shorter-term matters, there are ones of longer duration. For example, shrinking of glaciers and icecaps is said to expose darker rock, leading to greater light absorption. This is true, but what is seldom pointed out is that it also leads to greater radiation of heat out from the Earth, and this radiation takes place day and night, even in areas close to the poles where little sunlight penetrates.
Heat Capacity of the Earth
We can get another handle on the scale of effects in global temperatures by looking at heat capacities - the abilities of different substances to hold heat energy.
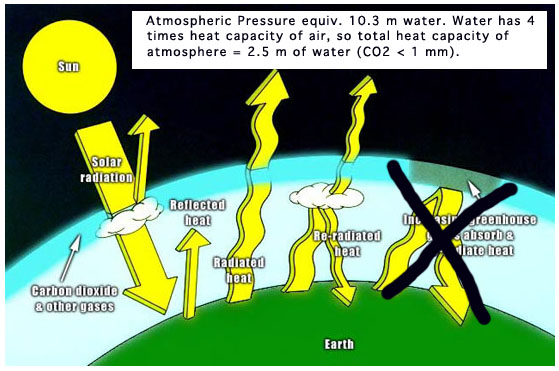
Figure 4. Heat capacity of the atmosphere
Scientists and plumbers, among others, know that the pressure of the atmosphere at sea level is equal to that of a water column around 10.2 metres high -- 34 feet was the old equivalent.
Water has 4 times the heat capacity of air. This means that the total heat capacity of the entire atmosphere is equivalent to that of a layer of water on the surface around 2.5 metres thick.
This simple equivalence gives pause to reflect whether exaggerated stories of the atmosphere heating up and destroying the environment can have much credibility.
When you look at the carbon dioxide content of the atmosphere, at around 0.036 %, this has the heat capacity of a layer of water less than a millimetre thick. Yet there are those who insist that the heat capacity of the man-made part of this, a third of a millimetre, has the capacity to drastically alter the Earth.
Heat capacity of the seas and oceans
In contrast, the average depth of Earth's oceans is around 3.5 kilometres, so the oceans have more than a thousand times the heat capacity of the air. This water, a liquid which can transfer heat by convection, thus totally dwarfs the heat capacity of the atmosphere.
Moreover, sunlight penetrates into the oceans down to a depth of around 100 metres. Penetration of sunlight into solid earth is negligible, and conduction of heat down from overlying warm air is limited.
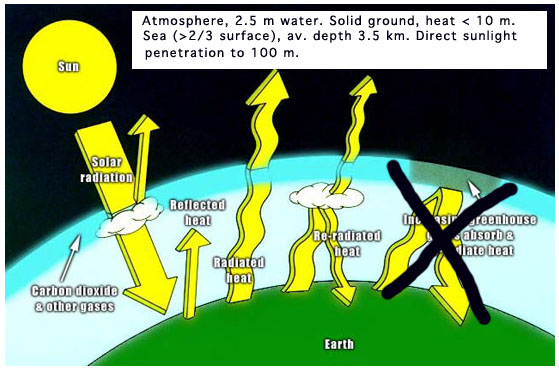
Figure 5. Heat capacity of the seas and oceans
For actual figures, daily variations in temperature at the soil surface are completely ironed out at a depth of 1 metre, and yearly variations don't show up at all below 20 metres [8]. Longer-term temperature variations do penetrate very slowly into the ground, sometimes over centuries, so the soil is a significant reservoir of long-term heat capacity.
In summary, the Earth's atmosphere has potent and rapid mechanisms for heat transfer, via winds, but has little heat storage capacity. The seas and oceans have immense heat storage capacity, and vast, if languid, ability to transfer heat. The soil is capable of responding to long-term temperature fluctuations by storing or releasing heat, but its heat transfer role is negligible.
Something like a Greenhouse
If you happen to watch the maximum and minimum temperatures in London, you may notice that on some days they are the same. The variation over the whole day is less than one degree.
This usually happens when the sky there is completely overcast. A thick layer of cloud prevents the free upward movement of warm air, and there is little wind.
While not the 'Greenhouse Effect' as usually meant, this is a real effect, similar to that in a plant greenhouse.
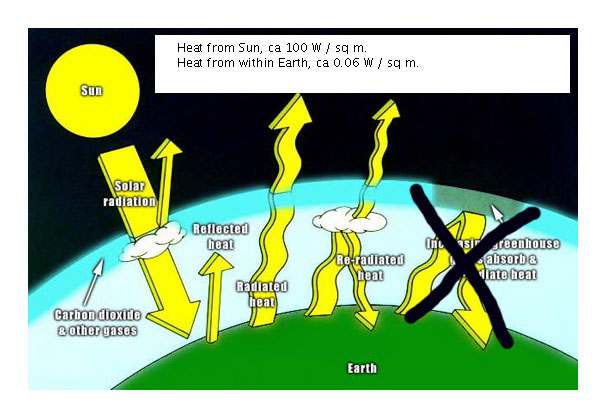
Figure 6. Heat from the Sun and from under the Earth
Then there is the matter of temperatures at the surface being more regular under a thick atmosphere than they would be without this, which certainly makes it more feasible for life processes to operate here. On the surface of the Moon, the same distance from the Sun as the Earth, the temperature may change from -150 C at night to +120 C in the day.
This range, of 270 C, is obviously far greater than the day/night range at any point on the Earth, where a daily range of 20 C is unusual.
It is often claimed that a 'Greenhouse Effect' raises the average temperature on Earth and so makes life more feasible. It is said that Earth's average temperature is around +15 C. On the Moon, the midpoint in its range (not necessarily the average) is -15 C, which looks to support the idea. However, both bodies in space are subject to the same heat input and output balances.
The solar flux, the average amount of energy from the Sun reaching the Earth's surface, is estimated at about 100 Watts per square metre (enough to run a largish light bulb) [8]. There is also energy, the geothermal flux, which comes up from within the Earth. Although much smaller, at 0.06 W / sq m, this energy is very steady and has been continuing since remote geological times.
So it could be said that the higher surface temperature of the Earth is just due to the insulating effect of the atmosphere in keeping in this 'internal' heat. Temperatures rise about 25 C for each kilometre you go down in the Earth, so the average temperature at 1 km down will be around 40 C, due to the extra insulation of the intervening crust. Of course, the Moon is unlikely to have the same amount of heat flow from its interior.
Even thicker atmospheres
Above it was noted that on cloud-shrouded Venus the atmosphere is very thick (90 times Earth's), and surface temperatures are very high, "enough to melt lead" is often quoted. This has been ascribed to a 'Runaway Greenhouse Effect', but is probably only due to the same factors as on Earth, but more so. If this reasoning is accurate, then the variation in temperatures between equator and poles on Venus should be much smaller than on Earth.
Interestingly, there is evidence that in Earth's distant past its atmosphere was much thicker than now, and it may have been perpetually shrouded in clouds, as Venus is now (see p. 115 in my book Nuteeriat [9]). This would have given much more even temperature conditions over the Earth, and would explain a puzzling feature of some dinosaur fossils found in Victoria.
These fossils from the south coast of Australia are of creatures believed to have existed in dim-light conditions, close to the then South Pole. At that time, the evidence is that similar warm conditions existed over most of the Earth, making abundant life possible even in polar regions. The thick blanket of cloud would have evened out temperatures over the whole planet.
Predicting the end of the current warming trend
To work out when the current warming trend may end, we need to look at some details of the temperature cycles.
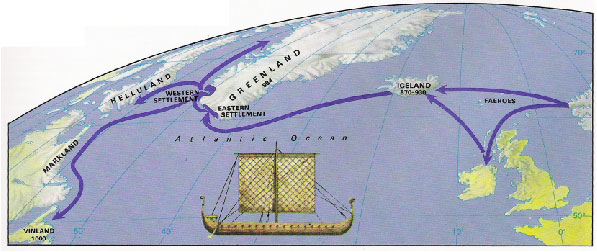
Figure 7. Viking colonizations. From [10].
Beginning back around 900 AD, some 1100 years ago, the Vikings embarked on a series of colonizations.
Figure 7 shows how they sailed forth and established colonies first on Iceland, then Greenland, and eventually on the northeast coast of North America.
It's obvious that climatic conditions were such that this colonization was feasible. 'Greenland' gained this name from the Vikings because at that time its coast, at least, was green and allowed crops to be grown.
Eventually these balmy climatic conditions, at least as warm as now, fell apart. Really cold times came. In Britain, in 1063, the River Thames in London was frozen over continuously for 14 weeks [11]. Eventually the Greenland colony succumbed to the increasing cold. There are no records of the colony being abandoned, instead it appears that the Greenlanders all perished.
Wind back the clock another 1000 or so years, and you come to the period when the Romans occupied Britain. The Romans brought with them grape vines, growing these and producing wine even in more northerly parts of Britain.
Obviously conditions then were warm enough to allow grapes to grow in the open. It was only from the 1990s onward, that the British climate warmed enough for open-air commercial grape production to become viable.
Bring out the charts
Now we should look at some actual data from current studies, and the conclusions which have drawn from them.
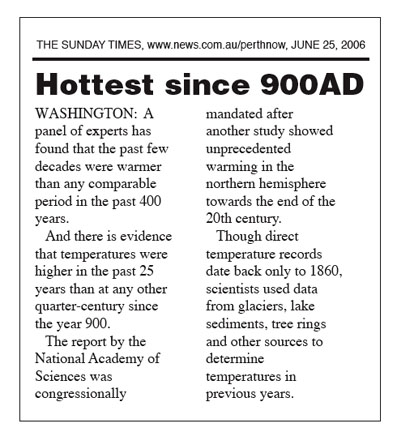
Figure 8. From [12].
A first look at this article might raise worries -- the Earth is getting hotter and hotter, where will it end? But look again at what it says.
It suggests that the 25-year period up to 2000 AD was probably the hottest, on average, since the 25-year period up to 1000 AD. So there was a temperature peak after 900 AD which was slightly above that occurring today.
So it's just an expression of a long, around 1000-year, cycle. Incidentally, there's nothing to suggest that extra CO2 was being put into the atmosphere before 1000 AD, so CO2 clearly doesn't figure in this.
You may notice that this newspaper report was based on a publication put out by the US National Academy of Sciences, and that the conclusions were based on measurements of glaciers, lake sediments, tree rings, and other sources. This publication [13] is a solid 155-page report, available online.
Figure 9 is redrawn from Figure S-1 in [13], to show how temperatures varied in the last 1100 years, according to measurements on tree rings made by Esper and colleagues in 2002.
These measurements are probably the most sensitive of the methods used, although they are somewhat localized. In this case, the measurements used a selection of non-tropical, northern-hemisphere trees.
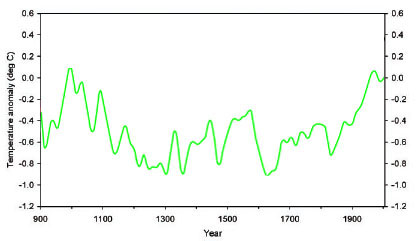
Figure 9. Northern-hemisphere temperature data based on tree rings. Redrawn from [13].
From this figure you can see the temperature peak reached around 1000 AD, followed by falls and rises all below this peak, until in the last 150 years or so temperatures rise again to around the 1000 AD level.
The Gulf Stream
We've seen earlier how ocean currents may have huge heat content and so can influence global climates. Figure 10 shows the heat content in some of these currents.
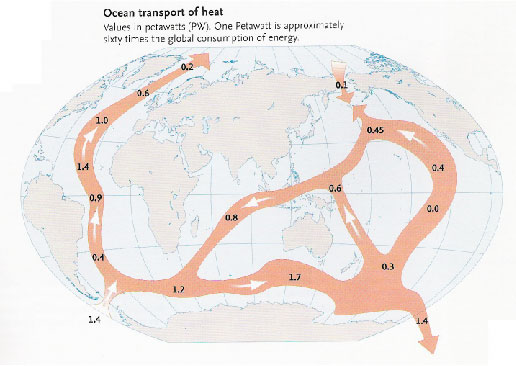
Figure 10. From [14].
Notice the very large movement of heat northwards from the Caribbean, carried in the Gulf Stream (the existence of which was worked out by Benjamin Franklin). According to this figure, at its peak the Gulf Stream carries 1.4 Petawatts of energy, over a hundred times global energy consumption. Another sobering reminder of the small place of Man at the global level!
Estimates of the heat carried in the Gulf Stream to Western Europe suggest that it raises land temperatures around 6 C above what they would be if it didn't exist. You can see this is about right if you compare places on similar latitudes not reached by the Stream.
For example, John O' Groats, at the northern point of Scotland, is well outside the range of north polar ice. It is on the same latitude as Churchill, a port on the western side of Canada's Hudson Bay.
Hudson Bay is frozen over every year. Global warming is raising hopes that Churchill could soon function as an all-year-round port, enabling its railhead to economically take goods to the central USA.
For a visual grasp of the effects of the Gulf Stream, you could think of every degree C it raises temperature as a layer of 'anti-ice' 1 kilometre thick, spreading out in tongues over the western European landscape.
Look also at the size of the temperature rise it brings. A 6-degree rise is well above the most alarming forecasts of the doomsayers, and yet it is in effect here today. If the Gulf Stream stopped, or even faltered, this could really be bad news for Europe.
The waters of the Gulf Stream don't somehow disappear after warming Europe, instead they sink to the ocean floor and move off around the globe in a sinuous, complex cycle. According to Nicolas Cheetham (p. 65 in [15]), this cycle takes around a thousand years. Now that's a familiar number somewhere.
The Arctic ice
Those who study the extent of floating ice in the Arctic are convinced that it is reducing year by year, and many of them think that in the future there will none left at the end of future summers.
In a 2007 news item [16] it was reported that Mark Sereze, of the US National Snow & Ice Data Centre in Colorado, had found the rate of shrinkage had speeded up. Instead of the previously forecast dates of 2070-2100 for a complete meltdown, he anticipated it could occur by 2030 -- in 2017, only 13 years away.
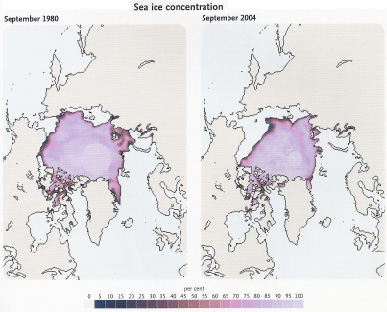
Figure 10. Autumn ice extent in the Arctic, 1980 and 2004. From [14].
Figure 10 shows that, in fact, there has been a visible reduction in the amount of sea ice, each summer ending with more and more of the previous winter's production gone.
While the actual reduction in area may not be dramatic, over 24 years, there is an important point to be made. As yet there is not a clear, ice-free passage through between the Atlantic, Arctic, and Pacific Oceans, but in a few years there may be.
It seems quite possible that the existence of such a clear passage, even for part of the year, could alter the flow of the Gulf Stream and its huge heat-distribution load.
Back to the Tree Rings
Figure 11 is the same tree-ring data as in Figure 9, with a simple extrapolation. Data from the drop after the 1000 AD peak has been copied and superimposed (in red) on the present peak.
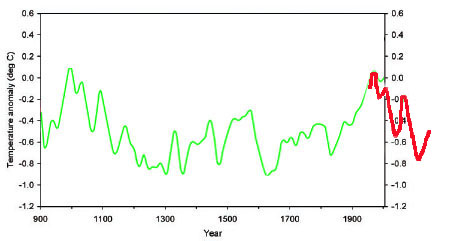
Figure 11. Forecast of temperature drop assuming past pattern repeats.
Now clearly it is unlikely that the previous pattern would be exactly repeated in all details. But it can't be said that it couldn't happen, because last time it did happen.
This extrapolation suggests that temperatures, at least in the temperate northern hemisphere, may hit a low around 2050 AD. Remember that after the 1000 AD peak, there was that 1063 AD low in Britain, with the Thames frozen over for 14 weeks. And then there is that 2030 AD prediction for a clear ice path through the Arctic Ocean.
Wrapping it up -- The science
It's clear that an understanding of the heat capacities of different parts of the environment, and of patterns of heat transfer within and by these, are the key to a real explanation of what's happening with climate.
The question of ice, in glaciers and especially in polar icecaps, is a very important part of this. In a way, this ice is like the pressure relief tank in a car's water circulation system -- both provide a buffer volume where shorter-term fluctuations may be smoothed out.
Ice is especially good in this role. Melting some ice needs a lot of heat -- not only to raise its temperature, but more also to change from solid to liquid. In freezing it, again a lot of energy must be extracted. And the resulting solid stays put, any flow of ice is very slow compared to liquid water.
While the 1000-year temperature cycle may well be driven by changes in solar radiation, the heat storage, transfer, and buffering mechanisms looked at above provide a normally reliable, comfortable jacket for life on Earth, one not available on airless bodies like the moon.
As to world atmospheric CO2 levels, the truth is that, even at the current 0.036 % content, carbon dioxide is only a trace element, eagerly scavenged by plant life in order to carry on the essential photosynthesis processes which make life on this planet work.
While 'Global Warming' is not a real problem, there are some genuine problems which Earth does have. Two major ones are overpopulation, and loss of tree cover.
Tree clearing by Man really kicked off with the development of agriculture, some 15,000 years ago. This date is somewhat earlier than the usually accepted time for this innovation, but if you look at the charts you will see it is then that CO2 levels started their current rise.
Earlier I pointed out that if all the CO2 in the atmosphere were separated out into a layer on the surface, it would be only a few millimetres thick. I've shown in earlier calculations (see p. 179 in Nuteeriat [9] ) that to restore even half tree cover over the whole Earth, you would need some 7 times the amount of CO2 in the present atmosphere. Carbon dioxide is rare and valuable, not a 'pollutant' at all.
I suggest that if all the above was presented in court, in the case of Greenzilla v. Society, the verdict would be 'proven beyond reasonable doubt'. But the accused might be let off, on the grounds that they were only a myth and thus of diminished responsibility.
But the World is not a court and does not operate by the defined procedures which would apply there. So let's look at what might happen in the Real World.
Wrapping it up -- Life in the Real World
In 1852 Charles Mackay published the second edition of his book Extraordinary Public Delusions, and the Madness of Crowds.
This book deals with some of the great scams, swindles, hoaxes, delusions, and general misconceptions which have taken on general public acceptance in the past. These include the Mississippi Scheme, the South-Sea Bubble, Tulipomania, Alchemy, Witches, and the Slow Poisoning craze of the 1600s. So the Greenzilla Myth is not a new phenomenon.
What is new with Greenzilla is its world-wide coverage, almost certainly only possible because of the 'one-click-away' availability of stuff from the Internet and the all-embracing, immediate, news and phone access.
When the Tulip Mania gripped Holland in the 1600s, with one rare bulb sold for the price of a house, and another highly expensive specimen accidentally cooked and eaten by a sailor who mistook it for an onion, at least the mania was mostly confined to Holland.
And it was not a matter affecting just the idle rich. Mackay says that in 1634, the "rage among the Dutch to possess them was so great that the ordinary industry of the country was neglected, and the population, even to its lowest dregs, embarked in the tulip trade".
So it is now with the Greenzilla Myth. The actions of governments, the budgets of companies and states, are being deflected from rational paths by a myth. Every item in the newspaper has its global warming angle.
In response to the question in the title, "Will Greenzilla Destroy the Earth?", the answer is clearly "No", a myth does not have this power. But how will Level Two and Level Three factors, Commercial and Sociological Imperatives and Philosophical and Religious Beliefs, work to retain their hold on all the aspects of our world view?
There could be a rapid collapse in the myth, it would only take one bold nation to recognise that The Emperor Has No Clothes, and the rest would follow like the collapse of a house of cards.
Or it could be a slow process, waiting for entrenched conservatives to die off or go out of power, as in the wry quotation on scientific acceptance, 'Science advances Funeral by Funeral'.
Whatever, the process will not be without trauma. A well-run company may be shaken to its roots when it is suddenly discovered that the well-known and liked and trusted Sales Manager has been quietly embezzling away much of the company's capital.
So then with much of our Society's intellectual and moral capital. A reversal of views on 'Man-made Global Warming' would involve much painful upheaval in budgets, jobs, and research directions, and above all, in loss of face.
Of course, all this could be short-circuited by an unexpectedly quick action by the powers of climate -- not much point in worrying about global warming when the snow and ice are advancing rapidly toward you. But in the absence of this, perhaps the advice of Gandhi on bringing about overdue change might apply.

Quotation Q5
* * * * * * * * * * * * * * * * * *
(Grateful thanks and acknowledgements are due to a host of workers who have provided much of the data and insights used in this article, especially to William Kininmonth. However, responsibility for opinions not specifically ascribed to others rests with me.)

References and Links
[1]. Martin Durkin. The Great Global Warming Swindle. WAG TV, UK, 2007.
[2]. The Greenhouse Effect.. From
http://www.virtualsciencefair.org/2005/stro5c0/public_html/greenhouse_effect.jpg,
[3]. CO2 and Temperature levels. From: Map: Antarctica. National Geographic, 2002.
[4]. Michael Goodfellow. Global Warming: Our Story So Far. http://www.oftwominds.com/journal/global-warming.html.
[5]. William Kininmonth. Climate Change: A Natural Hazard.. Multi-Science Publishing, Essex UK, 2004. ISBN 0 906522 26 9.
[6]. Albedo values.. http://www.asterism.org/tutorials/tut26-1.htm .
[7]. David Noel. The HydroSolar package: The complete answer to concerns about energy shortages, oil crises, greenhouse gases, global warming, power station pollution, and environmental headaches?. http://www.aoi.com.au/bcw/HydroSolar.htm .
[8]. Temperature At and Below the Earth's Surface.
http://esrc.stfx.ca/borehole/node6.html .
[9]. David Noel. Nuteeriat: Nut Trees, the Expanding Earth, Rottnest Island and All That ... . Subiaco, Cornucuopia Press, 1989, or online at http://www.aoi.com.au/matrix/Nuteeriat.htm .
[10]. The Vikings.. The Times Atlas of World History. Times Books Ltd, London, 1979.
[11]. Thames frozen over for 14 weeks in 1063. http://www.londononline.co.uk/history/norman/4 .
[12]. Hottest since 900 AD. Sunday Times (Perth), 2006 Jun 25.
[13]. Surface Temperature Reconstructions for the Last 2000 Years. National Academy of Sciences, Washington, 2006. Online at www.uoguelph.ca/~rmckitri/research/NRCreport.pdf .
[14]. Arctic, Gulf Stream. Collins Complete World Atlas. HarperCollins Publishers, Glasgow, 2005.
[15]. Earth. Smith-Davies Publishing, London, 2005.
[16]. Arctic Meltdown: sea ice will vanish by 2030. Sunday Times (Perth), 2007 Aug 19 p.39.
[17]. Charles Mackay. Extraordinary Public Delusions, and the Madness of Crowds. Facsimile of the 1852 edition. Farrar, Straus and Giroux. New York, 1932.
Go to the EP Home Page
(Based on a talk given to the Peel Branch of the Institution of Engineers, Australia
at Mandurah, WA, 2007 September 11)
Version 2.0 placed on Web 2007 Sep 30. Version 2.1, minor reformat and edits, 2017 Feb 28.
