EP298: Finally, the True Origin of Earthquakes?
David Noel
<davidn@aoi.com.au>
Ben Franklin Centre for Theoretical Research
PO Box 27, Subiaco, WA 6008, Australia.
Earthquakes
What do really know about earthquakes? They can be devastating natural occurrences in some parts of the world, capable of causing great loss of life and abrupt alterations to local landscapes.
Extremely detailed records now exist for all significant earthquakes of modern times. But, perhaps surprisingly, very little is known (or even speculated) about what causes them.
Even more surprising, in an age where science has provided so many convincing explanations of the physical world, is that almost nothing is known about the origin of the truly vast amounts of energy which may be released in earthquakes,
According to Wikipedia [4], an earthquake (also known as a quake, tremor or temblor) is the result of a sudden release of energy in the Earth's crust that creates seismic waves.
Earthquakes can be events of great threat and interest to many of the world's peoples, and have been been intensely studied during past centuries. The following figure is a map of where over 350,000 earthquakes occurred in the 35 years up to 1998.
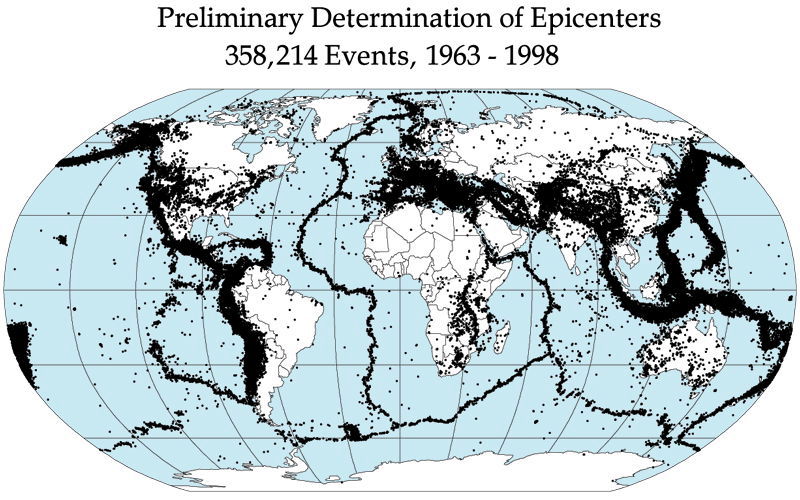
Fig. FOE1. Earthquake epicentres. From [4].
This figure is perfectly good science, based on measurements and observations. There are actually around 1 million earthquakes per year on Earth, detectable by sensitive equipment, so the average 10,000 earthquakes per year used in the figure will be based on the strongest one percent of these.
From earthquake plots like these, it is common to take a step which is not-so-good science. The step is to join up lines and dots to form irregular shapes covering the whole of the globe, and call these "Tectonic Plates".
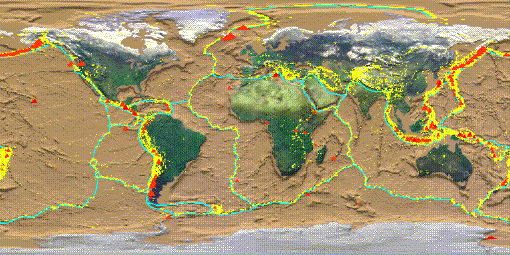
Fig. FOE2. Joining the dots to make "Tectonic Plates". From [5].
Really, this process for defining so-called Tectonic Plates is pretty much a nonsense, not because of how it's done, but because what is read into the word "plate". Advocates of the term assume that their "plate" has many of the characteristics of a household ceramic plate -- rigidity, coherence, and ability to move as a unit.
The essence of an earthquake is that it involves a relative movement along a line at a point on the Earth. The land is split, with one part moving leftward or rightwards, sometimes upwards or downwards, relative to the other.
There is nothing in reality to support the idea that 'plates' can move as units. They could not rotate, could not move relative to one another without leaving great gaps in the Earth at points they were moving away from.
Notice also, that some of the so-called "plate boundaries" are pretty selective as which dots are used to define plates, and which are ignored. Later, we'll look at a revised version of this figure, which brings out how some "plate boundaries" follow well-established zones of earthquakes, and some are drawn in arbitrarily to make a complete "plate".
Furthermore, on comparing with Fig. FOE1,you can see that there are plenty of dots (as in southern Africa and Australia), which don't form part of any plate "boundary". Many dots appear in the middle of so-called plates, and could not be due to plate movement.
Worse still, the conventional claim is that relative movements of 'plates' actually causes earthquakes. This is turning the logic of the matter on its head -- the plates are defined by observed earthquakes, not the other way round. Earthquakes cannot be understood while the false concept of "Tectonic Plates" is the basis of explaining them.
Proposition FOEP1
If the "Tectonic Plates" concept is bad, even worse is the suggested mechanism causing them to move -- "Convection Currents" circulating within the Earth. Of course, such currents are impossible within the solid rock which forms the outer Earth.
Wikipedia does list three mythological reasons for earthquakes. In Norse mythology, earthquakes were explained as the violent struggling of the god Loki, as he resisted attempts to poison him. In Greek mythology, when the earthquake god Poseidon was in a bad mood, he struck the ground with a trident, causing earthquakes.
In Japanese mythology, Namazu is a giant catfish who causes earthquakes. Namazu lives in the mud beneath the earth, and is guarded by the god Kashima who restrains the fish with a stone. When Kashima lets his guard fall, Namazu thrashes about, causing violent earthquakes.
A cynic might say there is also a modern Western mythology, called Tectonic Plates.
Down in Bremer Bay
Down on the southern coast of Western Australia, there is a small town called Bremer Bay. The population is only great enough to support one provisions shop, the Bremer Bay General Store.

Fig. FOE3. Bremer Bay General Store
On the wall opposite the checkout of the store is displayed a marine chart of the area, a chart which must be seen out of the corner of the eye by everyone leaving the store.
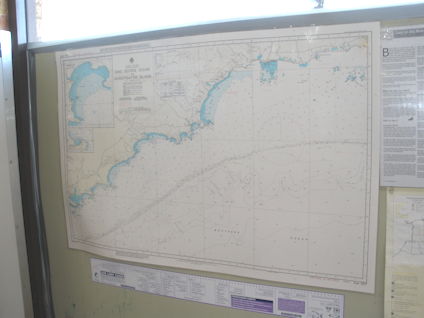
Fig. FOE4. Marine chart for Bremer Bay
Yet if the chart is looked at closely and understood, it shows a natural feature which, if on land, would be regarded as an eighth wonder of the world. Off the south coast there is a sheer cliff more than 4 kilometres high, twice the height of Mount Kosciuszko, the highest mountain in Australia.
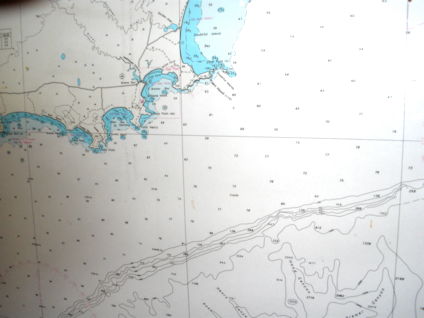
Fig. FOE5. Submarine contours off Bremer Bay
Depth contour lines on a simple marine chart do not have the impact of a 3-dimensional image. Such an image can be had using the computer application Google Earth [6]. Here is one showing the south coast of WA.
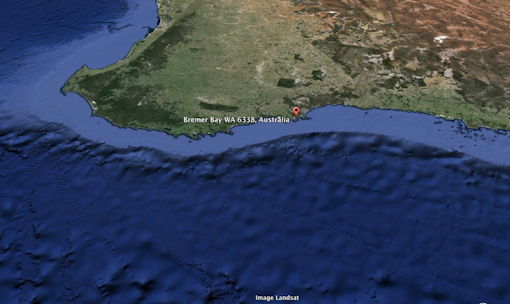
Fig. FOE6. Angled view of southwest WA coast. From [6]
A closer view brings out the nature of the submarine cliff.
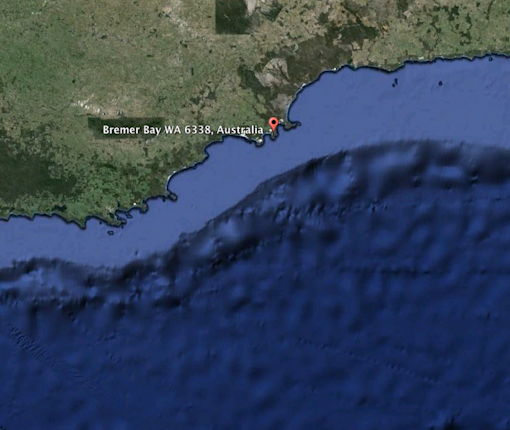
Fig. FOE7. The submarine cliff off Bremer Bay. From [6]
These cliffs are, in fact, common around the world, usually described as "the edges of the continental shelf". How is it that these astonishing natural features don't exist on land?
Erosion under the sea
Part of the reason why these cliffs still remain, is that erosion forces under the sea are different to those on land. There are no scouring winds or high-impact raindrops, no freezes causing ice to split open rocks, and the effects of gravity are much reduced by the upthrust of surrounding water.
There are some influences on submarine rocks. Turbidity currents (sand-laden flows near river mouths) can cut canyons in the offshore rocks. Wave action can cause strong erosion, but only at the immediate shore. Sea currents have little effect.
There is an important long-term factor operating, that of slumping. Surprisingly, rocks do actually flow and slump under gravity, but enormously more slowly than, say, jelly or ice. However, none of these forces can create the steep cliffs seen worldwide at the edges of continental shelves. To explain these, we need to look at research which began back in the 1830s, but is only now beginning to find widespread acceptance.
The Expanding Earth
The concept that our Earth has expanded considerably over geological time is now slowly overturning entrenched resistance with a series of proofs and evidence which the establishment has not been able to counter.
An older, fairly comprehensive account can be seen at Fixed-Earth and Expanding-Earth Theories [7]. A more recent article, on a narrower topic, is How Seafloor Spreading affects the level of oceans and seas [8].
Let's look now at the particular case of the Bremer Bay cliff. Looking at the earlier Google Earth images, the suggestion that another piece of land has been pulled away from the SW Australia coast, leaving this cliff at one side, does look intuitively possible. Where is the other side of this rupture? It is now on the corresponding coast of Antarctica.

Fig. FOE8. The seabed between Bremer Bay and Antarctica. From [6].
Now to support this intuition with evidence. There is an excellent map [9] showing the ages of the seabeds over the whole of the Earth. This map is the result of years of research in taking seabed rock samples and determining their ages -- none are older than about 180 million years. Here we show the part which includes the seabed between Australia and Antarctica.
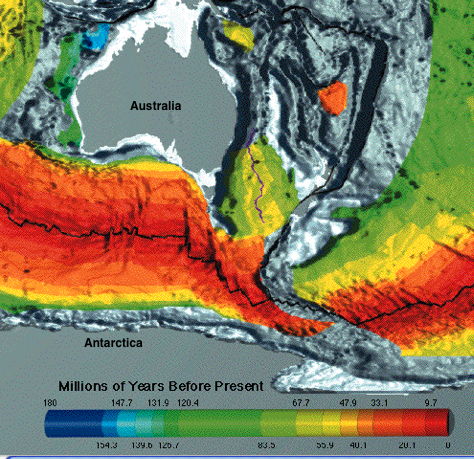
Fig. FOE9. Ages of the seabed between Bremer Bay and Antarctica. From [9].
Because we know the ages of all the rocks in the southern Australia/ Antarctica rift, we can describe the event which caused it, in some detail. About 100 million years ago, the continents were joined. At that time the rift opened, relatively slowly at first, and at 50 million years ago was about a quarter of its present size.
By 30 million years ago, the rift was around half its present size. At 20 million years ago rifting accelerated, and reached 75% by about 10 million years ago. At the present time, new rock is being created at the mid-ocean rift, shown by the black line on the figure. This process, known as Seafloor Spreading, is described in more detail in [8]. The black line marking this very active process is also the site of the earthquake band in this area, visible on figures FOE1 and FOE2.
If you examine the whole-Earth version of the crustal map [9] it can be seen that all the modern deep seabeds were progressively created by the Seafloor Spreading process over the last 180 million years. Compared to the age of the Earth, about 4600 million years, this is a fairly recent process.
Importantly, because this new surface rock, now occupying some two-thirds of the planet's surface, is additional to what existed previously, the Earth must have expanded over this time. In fact its radius must be close to double what it was 180 million years ago.
Proposition FOEP2
This proposition may be new to some, but it is almost inescapable in the light of the current evidence. Certainly the old Fixed Earth-Tectonic Plate theory has no possible way of accounting for this evidence.
So, we know that the Earth has expanded in the past, and continues to do so today. Now we can work out how the expansion process inevitably causes earthquakes, and look at an explanation of what causes expansion. But first, let's see if we can extract a little more hard data from the Bremer Bay situation.
Profile of the Bremer Bay sea-cliff
When you look at an area with Google Earth, the line of information at the bottom includes the height above sea-level (or the depth of the seabed below sea-level) for the point where your cursor sits.
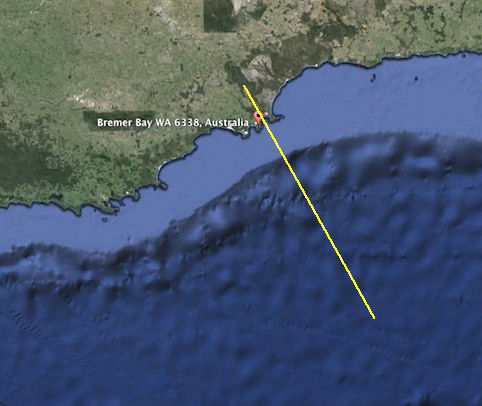
Fig. FOE10. Line of cross-section over the Bremer bay sea-cliff
So if you move the cursor along a line which would form a cross-section of the area which interests you, and write down the height/depth at regular intervals, you can build a table which can be used to construct the cross-section.
 .
. 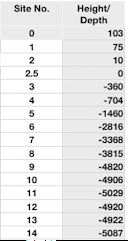
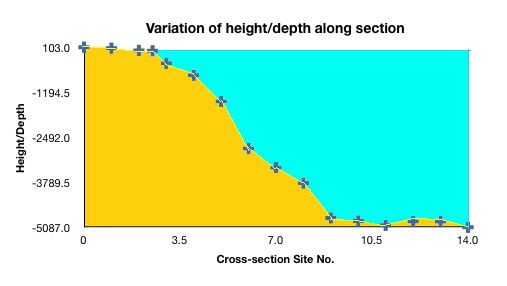
Fig. FOE11. Cross-section and data for the Bremer Bay sea-cliff
This is a typical picture for the edge of a continental shelf. Nothing remotely similar will exist on the Earth's land surface, only in the sea. The technique used here is only rough, but adequate to bring out the facts.
One of the surprises from this cross-section is that the continental shelf itself, from the shore to where it drops off sharply, is not as shelf-like as the Google Earth pictures might make you think. In fact, while the cross-section does have a point where the rate of fall-off is greatest, above this the 'shelf' is actually quite tilted.
Apparently, this tilting is due to slumping of the shelf during the long interval between when it was first rifted and the present -- some 100 million years. The length of the line of cross-section in Fig. FOE10 is about 290 km, so the actual shelf section is about 40 km wide..
Stretching the Earth's surface
As the Earth expands, naturally its surface undergoes stretching. Stretching occurs at all sorts of scales and with varying effects.
 .
. 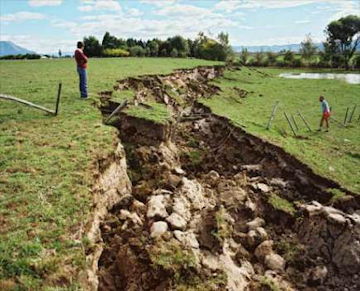
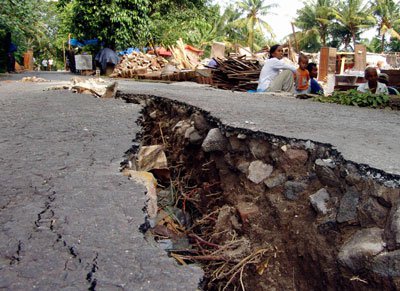
Fig. FOE12. Earthquakes stretch the ground. From [10]
With a small local earthquake, the land is pulled apart or rifted. The effects shown in the figure, where the rift runs across a road or a field, are typical. These rifts are just what would be expected if the surface was being stretched through Earth expansion, and are are not explicable with the old tectonic-plate theory.
Typically, one side of the rift will end up lower than the other. This is because soil and rock are taken from one side to partially fill the rift. In theory, the rift represents an open wedge which would reach right down to the centre of the planet, but in practice the forces of soil and rock mechanics move to mostly fill the gap.
On a larger scale, at the mid-ocean rifts like that shown in Fig. FOE9, local activity is intense enough to melt the local rock. The animation shows how a continuous tongue of molten rock is created and spread on both sides of the rift as its sides are pulled apart.
Fig. FOE13. Seafloor Spreading. From [24] .
Live videos have been made of this process, showing what amounts to a 'slot volcano', with molten rock coming out of a slot many kilometres long, on the bed of the ocean.
As well as the mid-ocean ridges, where rock mechanics are able to maintain the active sites roughly on a plain, there are places where the sea-bed is pulled apart to create ocean trenches.
The deepest of these trenches is the Mariana Trench. It is located in the western Pacific Ocean, to the east of the Mariana Islands. The trench is about 2,550 km long but has an average width of only 69 km. It reaches a maximum-known depth of 10.91 km at the Challenger Deep, a small slot-shaped valley in its floor, at its southern end [3].
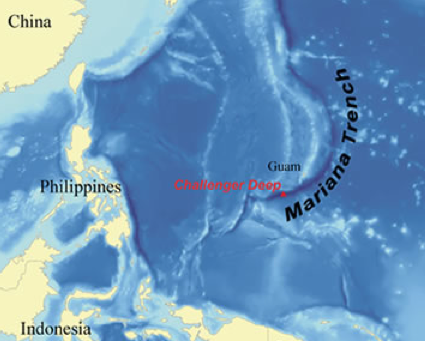
Fig. FOE14. The Mariana Trench. From [3]
We can get an oblique view of this sea-bed area with Google Earth.
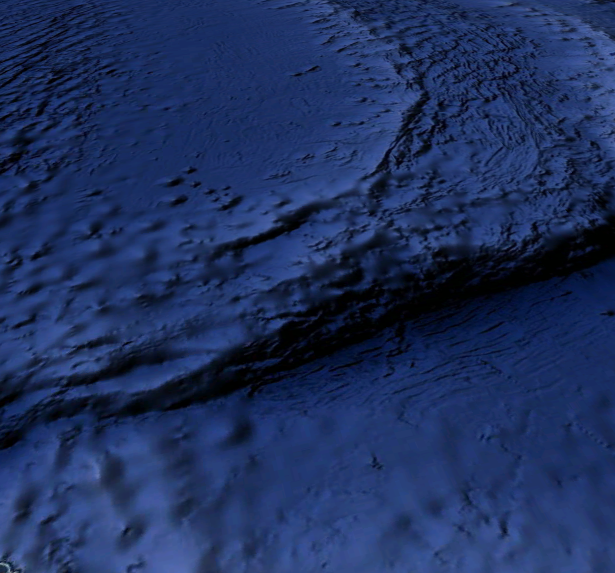
Fig. FOE15. Google Earth view of the Mariana Trench. From [6]
We can do the same sort of exercise as with Bremer Bay, to create a cross-section across the Mariana Trench. In this instance, the cross-section ruler is about 310 km long.
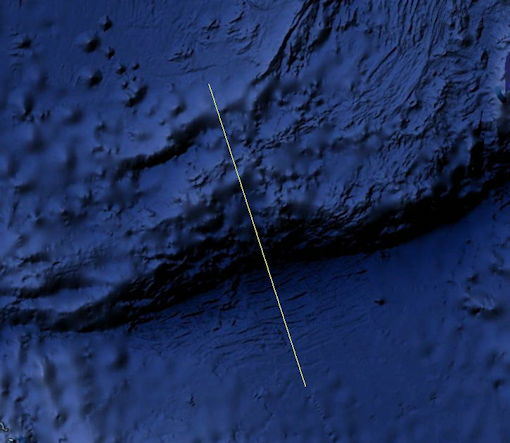
Fig. FOE16. Cross-section ruler for the Mariana Trench
The cross-section here is different in appearance to that at Bremer Bay. The trench resembles a river valley, but could very credibly be regarded as the result of slowly pulling apart an initial crack in the sea-bed, caused as its surface expanded.
It could also be looked at as a profile and its mirror image, as if the trench was at the very beginning of rifting apart a section of sea-bed, as at the start of the Australia/Antarctica rift.
 .
. 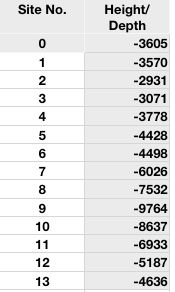
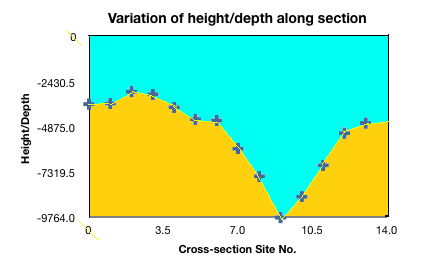
Fig. FOE17. Cross-section and data for the Mariana Trench
Of course, the old Tectonic-Plate theory has no way of explaining even the existence of ocean trenches.
Going down, down, down
OK, so we've got a fair idea of how expansion of the Earth creates various gaps in the surface. Why should these cause earthquakes?
It's really a matter of changes in potential energy as rock masses seek lower positions. There are many different ways in which this occurs, some are abrupt and very obvious, others are slower and more subtle, often not noticed.
Slumping. As already mentioned, large masses of rock do have the capacity to flow, albeit very slowly. The same is true of glass -- glass in very old windows can sometimes be measured as thicker at the bottom of the pane than at the top.
 .
. 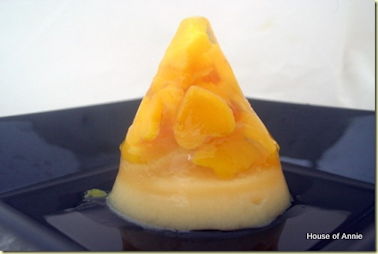
Fig. FOE18. Unslumped and slumped jellies.. From [11]
We're familiar with slumping in materials which have less cohesion, such as jellies. The figure shows how a jelly which has a good conical shape on release from the mould, may quickly slump to lose its shape. In so doing, the potential energy at the top of the cone is released.
Mass wasting. Rock mountains standing higher than the local plain are liable to mass wasting (the technical term for when bits of rock fall off), releasing potential energy.
Depending on the size and position of released rock, this wasting may be called an avalanche, or a rock slide.
As a massive rock fall contacts the base of the mountain, it may break into thousands of fragments that continue tumbling down slope at high velocity.  The great energy of such a large mass can enable a rock avalanche to travel much further from the base of the mountain than one would expect [12].
 .
. 
Fig. FOE19. Rock avalanches and slides. From [12]
A more subtle form of rock wasting is with erosion. Here the particles involved are small, and the energy release scarcely noticeable. On the other hand, erosion may be ongoing for thousands, even millions, of years.
Glaciers. The ice in glaciers can be regarded as a very poorly cohesive type of rock, where slumping or avalanching can be noticeable over just a few years. Different parts of the same glacier may move at different rates.
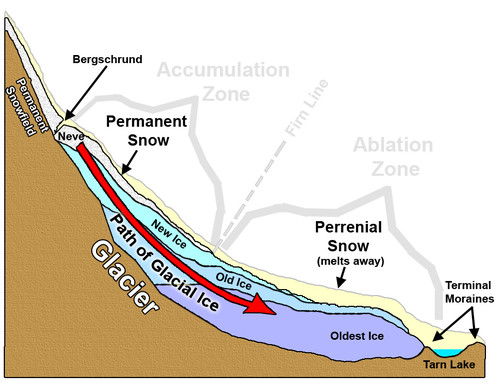
Fig. FOE20. Movements within a glacier. From [13]
If the glacier is in equilibrium, the head and terminus of the glacier will remain stationary as the melt at the bottom matches the addition of ice at the top. Although the glacier may appear stationary, it is still moving and eroding. Glaciers recede or grow when the formation of ice at higher altitudes becomes out of balance with the melt of the glacier at lower altitudes [13].
Earthquakes. Earthquakes very obviously involve both land movements and massive energy releases. The most familiar scale for measuring the size of earthquakes is the Richter Scale [14]. In this, an increase of 1 unit in magnitude means a ten-fold increase in amplitude (of the measured seismic wave) and an energy increase of 10 to the 1.5 power. So a magnitude 8 earthquake has 100 times the amplitude (and 1000 times the energy) of a magnitude 6 one.
The energy of earthquakes
How much energy is released globally by earthquakes? A search of the Web did not give any result for this important statistic. Nevertheless, a rough estimate can be made as follows.
The pattern of earthquakes follows the sort of distribution where there are huge numbers of events at very low energies, and numbers get less and less at higher energies. At the peak, there is one rare event of very high energy.
A rule of thumb for estimating the total energy release per year, for such a pattern, is to take the the energy of the strongest earthquake in that year, and double it. There is mathematical justification for this rule, in the shape of the energy-frequency curve, and probability theory, but that won't be gone into here.
So we can look at a recent very large earthquake for which energy release has been calculated, and go from there. A good example is that known as the Indian Ocean Earthquake or Boxing Day Tsunami of 2004. Here is an extract from [17] on this.
"The 2004 Indian Ocean earthquake was an undersea megathrust earthquake that occurred at 00:58:53 UTC on Sunday, 26 December 2004, with an epicentre off the west coast of Sumatra, Indonesia. The quake itself is known by the scientific community as the Sumatra–Andaman earthquake. The resulting tsunami was given various names, including the 2004 Indian Ocean tsunami, South Asian tsunami, Indonesian tsunami, the Christmas tsunami and the Boxing Day tsunami.
The earthquake triggered a series of devastating tsunamis along the coasts of most landmasses bordering the Indian Ocean, killing over 230,000 people in fourteen countries, and inundating coastal communities with waves up to 30 metres high. It was one of the deadliest natural disasters in recorded history. Indonesia was the hardest-hit country, followed by Sri Lanka, India, and Thailand.
With a magnitude of 9.1–9.3, it is the third largest earthquake ever recorded on a seismograph. The earthquake had the longest duration ever observed, between 8.3 and 10 minutes. It caused the entire planet to vibrate as much as 1 centimetre and triggered other earthquakes as far away as Alaska."
The energy released by this event has been stated as equivalent to 9,560 gigatons of TNT [16]. In standard scientific terms, 1 ton of 'TNT equivalent' equals 4.184 gigajoules. To give a feel for what these numbers mean, we can represent them as BL Units (where 1 BL unit is one-millionth of the average daily energy Earth receives from the Sun), and compare with other global energy flows.
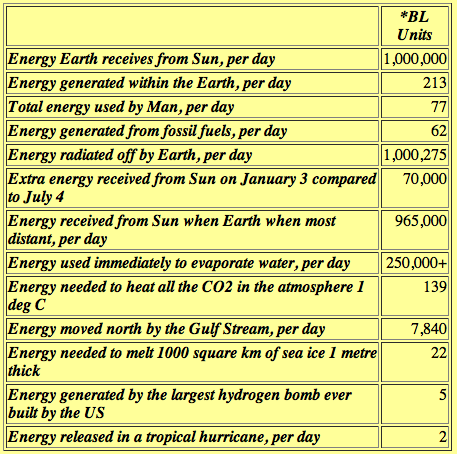
Fig. FOE21. Global energy flow figures. From [18]
The above table, from Temperatures of the Earth -- a globe in space [18], shows some estimated global energy flows in BL units. To compare these figures with earthquake energy release, some assumptions have been made.
For average daily energy release from earthquakes, the total energy of the Indian Ocean Earthquake is assumed equal to the average global annual release. This does not incorporate the doubling noted above, but then the IOE is not matched annually.
This approach is accepted as only very approximate, but should be of the right order. Applying mathematics to the situation (details in "Earth Temperatures Calculation Package", [19]) gives a figure of 7110 BL Units of average earthquake energy release per day. That's assuming I did the sums right.

Fig. FOE22. Average daily earthquake energy release
Comparing this result with the full table, it can be seen that earthquake energy is a very significant part of the total picture. It is 90 times the energy used by Man, and 33 times the energy which seeps up from beneath the Earth's surface (this is presumably due to quiet slumping, although it's usually attributed to decay of radioactive minerals).
In the context of global temperatures, it far outranks anything which we put into the atmosphere. And, although the comparison figure is converted to a daily output, in reality it is very erratic in expression. So the Indian Ocean Earthquake, in just 10 minutes, released about 90 times the energy that humans produce in a year.
So where does this energy come from?
Conventional geophysics and tectonic-plate science has no even mildly plausible answer to this question. From the above, it is fairly obvious that this energy release is an effect of expansion of the Earth.
Proposition FOEP3
More precisely, the energy from earthquakes, slumping, mass wasting, and other such sources is conversion of the potential energy contained in landforms as they adjust to the new radius of the Earth. In How Seafloor Spreading affects the level of oceans and seas -- The Expansion Equilibration Model [20] the mechanics of this process, called "equilibration", are examined in more detail.
Let's look at this process from the potential-energy aspect.
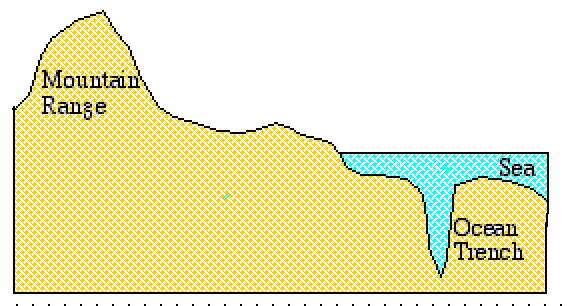
Fig. FOE23. Notional cross-section through a near-coastal mountain range and ocean trench. Adapted from [7]
In the figure, it can be imagined how erosion, mass wasting, and slumping of the mountain range gradually lower its higher parts, releasing their potential energy. On occasion, an earthquake may abruptly lower part of a shoreline.
Fig. FOE24. Expression of the 1964 Great Alaskan Earthquake. From [15]
This is well illustrated by the Great Alaskan Earthquake, a 9.2 magnitude event which occurred on Good Friday, 1964. In the coastal towns of Seward and Valdez, 1-kilometre long sections of the waterfronts just disappeared into the sea. Tsunamis struck much of the coast.
In the figure, a real-life equivalent of the notional cross-section in Fig. FOE23, the yellow line marks the location of the Aleutian Trench. The triangles mark active volcanoes [15]. Notice that the line of volcanos (also an expansion phenomenon) runs parallel to but displaced from the trench bottom, and from the earthquake line. Such a displacement, which implies that volcanos appear on the slope rather than high up or low down, is quite common.
How widening ocean trenches affect the potential-energy situation
Look again at the coastal mountain/ ocean trench schematic in Fig. FOE23, also at the cross-section of the Mariana Trench in FOE17. Before the trenches started to form, the sea-floor was roughly level. Now, in the case of the Mariana Trench, the sea-floor has opened up a crack up to 6 kilometres below the original sea-floor level.
The potential-energy implications of this are enormous. All the rock of the sea-floor and surrounding land can now theoretically fall a further 6 kilometres into the crack. In practice, the surfaces will slowly or rapidly equilibrate, via slumping or earthquakes, to accommodate the new conformation.
Obviously fall of rock will depend on the rock mechanics and profile of the trench, and may have effect over long times. But this is not true of the ocean water -- this will flow into the trench immediately under gravity, and this will be another source of potential energy conversion.
Here then is the source of the massive potential energy conversion, 7110 BL units per day, noted in FOE22. No other credible or consistent source has been identified.
Proposition FOEP4
The relevance of gradients and profiles
If the slope or gradient of a particular area of the Earth's surface influences how it might slump or slide, as would be expected, then a map showing gradients over this surface should correlate to some extent with recorded earthquake zones.
For some years I searched for such a gradients map, and even tried through Zombal to find someone to prepare one, always without success.
Finally, I located a reference to Barry Eakins, Lead Scientist at the US National Geophysical Data Center, where the ETOPO1 Global Relief Model [22] is maintained. I asked him for help or advice on this matter [21].
Very kindly, Barry was able to prepare for me a map using the ETOPO1 database, which gave the information I wanted.
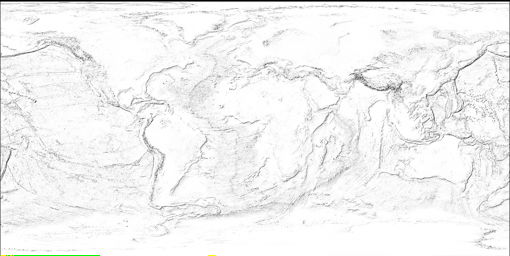
Fig. FOE25. Gradients at the Earth's surfaces. See [21] for source.
This figure is converted from a large file which uses the shadow technique to represent the slope of each of millions of cells on the surface. This is similar to techniques used by Google Earth to show slopes, as in Fig. FOE7.
In the next figure, the slope shadows shown in FOE25 have been processed to cut out the less-steep slopes, and the steeper slopes emphasized. These steeper slopes have then been superimposed on the dot-defined plate picture represented in Fig. FOE2 above.

Fig. FOE26. High gradients and earthquake zones
It will be apparent that this high-slope picture tells us quite a lot about the dot-plate representation on FOE2. Many of the high-slope lines do coincide with the "plate boundaries", but many do not, particularly where the "plate boundaries" have been drawn through sparsely-populated lines.
On the other hand, there are many of the high-slope lines which do not coincide with any earthquake/ volcano belts, and apparently represent relics of past expansion, no longer particularly active in the expansion process. There is a great deal more information which might be had from analysis of this sort of data.
Why do ocean trenches and mid-ocean ridges form where they have?
The question may be asked as to why surface features such as ocean trenches and mid-ocean ridges have appeared where they have, on the Earth's surface. Figure FOE27 is a schematic of an expanding interior capped by surface features of varying heights.

Fig. FOE27. Schematic of splitting lines for a varying-height expanding Earth. From [7]
This sketch, obviously very exaggerated, represents an Earth which is expanding uniformly from within and which has an outer layer of varying thickness or height above a uniform mantle.
If the question was asked as to where on this figure the surface would next be split open by expansion forces, the intuitive answer would probably be at A and B, where the land overlay is thinnest.
Rock-mechanics calculations should show whether this intuition was supported by theoretical analysis. If so, that would explain why some of the most active earthquake/ volcano activity is seen around or in the Pacific, our deepest ocean on average, as in the band popularly known as "The Ring Of Fire".
OK, then what causes expansion?
The exposition above gives detailed and weighty evidence supporting the assertion that earthquakes are caused by expansion of the Earth. If this is fair enough, the inevitable question is "What causes the expansion?".
Until recently, there was no very satisfactory answer to this. Obviously the energies involved are very major and continuing, hugely above the level which could stem from vague concepts such as internal heat of the Earth, or decay of radioactive elements. Even if such mechanisms were active, there is no way that they could continue to provide the required energies today, billions of years after the Earth's formation.
My suggested mechanism for expansion, and origin of the energy expressed in expansion, is in a stablemate article, Inside The Earth -- The Heartfire Model [23].
Full details will be found at that reference, but briefly, the model assumes that all stars, planets, and other celestial bodies were formed by aggregation of dust and gases, and that for bodies above a certain mass (a little less than that of Mars), the aggregation process compressed the core of the body to include a proportion of compacted neutrons.
Proposition FOEP5
With 'neutron stars', almost all their matter is compacted neutrons. With planets of mass equal to Mars and somewhat above, either the neutron-core is very small, or the core contains only a low proportion of compacted neutrons. These compacted neutrons decay very slowly to hydrogen atoms, with the release of energy and with considerable expansion.
In this model, Mars had only a tiny neutron core, and this fully decayed during its first billion years, hence Mars stopped expanding then. A fact which brings out the huge expansion capability of compacted neutron decay, is that if the Earth was made up entirely of compacted neutrons, it would be only about 300 metres in diameter.

Fig. FOE28. The Heartfire Model of the structure of the Earth. From [23]
If the Heartfire Model is valid (that is, it gives a picture which corresponds to reality), it results in a structure for the Earth like that in Figure FOE28. Comments on the main article, or on the Heartfire Model, are welcome.
* * * * * * * * * * * * * * * * * * * * * * * * * * * * * *

Stablemate articles
AOI articles with relevant evidence
[A]. Fixed-Earth and Expanding-Earth Theories -- Time for a Paradigm Shift?
[B]. How Seafloor Spreading affects the level of oceans and seas: The Expansion Equilibration Model. At:
http://www.aoi.com.au/bcw/Seafloor/ .
[C]. Temperatures of the Earth -- a globe in space. At: http://www.aoi.com.au/bcw/EarthTemp/ .
Inside The Earth -- The Heartfire Model. At: http://www.aoi.com.au/bcw/Heartfire/ .
References and links
[1]. Crustal Age. http://www.ngdc.noaa.gov/mgg/image/images/WorldCrustalAge.gif .
[2]. Deepest Part of the Ocean. http://geology.com/records/deepest-part-of-the-ocean.shtml .
[3]. Mariana Trench. http://en.wikipedia.org/wiki/Mariana_Trench .
[4]. Earthquake.
http://en.wikipedia.org/wiki/Earthquake .
[5]. How Volcanoes Work.
http://www.geology.sdsu.edu/how_volcanoes_work/Images/Diagrams/Vol_eq_plates.gif .
[6]. Google Earth.
earth.google.com/ .
[7]. David Noel. Fixed-Earth and Expanding-Earth Theories: Time for a Paradigm Shift? http://www.aoi.com.au/bcw/FixedorExpandingEarth.htm .
[8]. David Noel. How Seafloor Spreading affects the level of oceans and seas: The Expansion Equilibration Model.
http://www.aoi.com.au/bcw/Seafloor/ .
[9]. Earth Seafloor Crust Age.
http://upload.wikimedia.org/wikipedia/commons/4/44/Earth_seafloor_crust_age_1996.gif .
[10]. What Is an Earthquake? http://sriutami88.wordpress.com/2012/01/15/earthquake/ .
[11]. Golden Mango Kiwi Konnyaku.
http://www.houseofannie.com/golden-mango-kiwi-konnyaku/ .
[12]. Mass Wasting. http://geology.campus.ad.csulb.edu/people/bperry/Mass%20Wasting/Falls.htm .
[13]. What is a Glacier?. http://www.summitpost.org/glaciers/700719 .
[14]. Richter magnitude scale. http://en.wikipedia.org/wiki/Richter_magnitude_scale .
[15]. Tsunamis - Past, Present, and Future. http://oceansjsu.com/105d/exped_tsunami/t_1.html .
[16]. TNT equivalent. http://en.wikipedia.org/wiki/TNT_equivalent .
[17]. 2004 Indian Ocean earthquake and tsunami. http://en.wikipedia.org/wiki/2004_Indian_Ocean_Earthquake .
[18]. David Noel. Temperatures of the Earth -- a globe in space. http://www.aoi.com.au/bcw/EarthTemp/ .
[19]. Earth Temperatures Calculation Package. http://www.aoi.com.au/Calculations/EarthTempCalcs.htm .
[20]. How Seafloor Spreading affects the level of oceans and seas -- The Expansion Equilibration Model. http://www.aoi.com.au/bcw/Seafloor/.
[21]. Emails re Earth surface gradients. http://www,aoi.com.au/bcw1/Finally/Eakins.htm
[22]. ETOPO1 Global Relief Model. http://www.ngdc.noaa.gov/mgg/global/global.html .
[23]. David Noel. Inside The Earth -- The Heartfire Model. http://www.aoi.com.au/bcw/Heartfire/ .
[24]. File:SeafloorSpreadingMagAnimation.gif. https://commons.m.wikimedia.org/wiki/File:SeafloorSpreadingMagAnimation.gif .
Go to the BCW1 Home Page
Version 1.0 commenced 2015 May 1. Versions 1.1-1.4, May 2-23.
V. 1.5, first up on Web 2015 May 23. V. 1.6,
V. 2.0, simplified* & adjusted, uploaded* 2025 Jun 2.

>