UGAP3: Living In The Universe:
(What CMBR tells us about Dark Matter, and much more)
[The Four Pillars of GAU, Part 3]
David Noel
<davidn@aoi.com.au>
Ben Franklin Centre for Theoretical Research
PO Box 27, Subiaco, WA 6008, Australia.

Quotation LIUQ1
Part 1. LIGHT, HEAT, AND TEMPERATURE
We are used to receiving abundant energy from the Sun, mostly in the form of light and heat. The light is a form of electromagnetic radiation, of a range of wavelengths. Heat from the Sun is also electromagnetic radiation, of rather longer (infrared) wavelengths.
This radiation is a different form of heat energy from that we notice when we put a hand on a hot stove (conducted heat) or in a hot bath. For more background on forms of heat, see Temperatures of the Earth -- a Globe in Space [18].
Quite early in history, it was noticed that hotter objects glow with brighter, whiter, colours than cooler ones. When blacksmiths heat up an iron bar in a fire, it first glows with a dull red. As it gets hotter, the bar glows more brightly, with whiter colours. In physics, the "hotter" colours mean shorter-wavelength radiation, carrying more energy.
It turns out that everything in the Universe continually emits radiation, at a wavelength which depends on its temperature. Hot objects emit at short wavelengths, cold ones at longer (lower energy) wavelengths. At the same time, everything is receiving radiation from near and far objects.
At the "room temperatures" in which we usually live, objects emit radiation in the infrared band. But even very cold objects (like those in interstellar space which are distant from any stars) emit radiation, in this case in the longer-wave band we call microwaves.
At the start of the 1900s, a German physicist called Max Planck worked out how the radiation from a hot body varied with its temperature. This energy was not at a single wavelength, but followed a curve with a pronounced peak, the wavelength at which most energy was being emitted.

Figure LIUF1. "Black-body" radiation. From [6].
In the theoretical treatment, the emitting body is called a "black body". This is shorthand for an object which completely absorbs radiation of any wavelength.
The formula which Max Planck developed is called the Planck Radiation Law. It relates the intensity of radiation emitted (by unit surface area into a fixed direction from a body) as a function of wavelength for a fixed temperature [9].
About Max Planck
Max Planck is a major figure in the history of science. Here is an extract from [10] about him.
"Max Karl Ernst Ludwig Planck (April 23, 1858 -- October 4, 1947) was a German theoretical physicist who originated quantum theory, which won him the Nobel Prize in Physics in 1918. Planck made many contributions to theoretical physics, but his fame as a physicist rests primarily on his role as an originator of the quantum theory.
However, his name is also known on a broader academic basis, through the renaming in 1948 of the German scientific institution, the Kaiser Wilhelm Society (of which he was twice president), as the Max Planck Society (MPS). The MPS now includes 83 institutions representing a wide range of scientific directions.
Max Planck's quantum theory revolutionized human understanding of atomic and subatomic processes, just as Albert Einstein's theory of relativity revolutionized the understanding of space and time."
Max Planck was born in 1858, and lived to the age of 89. His work on black-body radiation was published in 1900, when he was already 42. "Planck's Law" describes the electromagnetic radiation emitted by a black body in thermal equilibrium at a definite temperature. It is a pioneering result of modern physics and quantum theory [9].

Figure LIUF2. Max Planck in 1878. From [10].
Planck had a full personal life. In 1887 he married Marie Merck, with whom he had four children. The Planck home became a social and cultural centre -- numerous well-known scientists, such as Albert Einstein, Otto Hahn and Lise Meitner were frequent visitors. Planck played piano, organ and cello, and followed a tradition of jointly performing music, established in the home of Helmholtz.

Figure LIUF3. Max Planck in older life. From [11].
In 1909 his first wife Marie died, and in 1911 Planck re-married and had a fifth child [10]. He outlived all four children from his first marriage; his oldest son Karl was killed in action in 1916, during World War 1.
His twin daughters Emma and Grete (who married Emma's widower) both died in childbirth, in 1917 and 1919, while his youngest son Erwin was executed by the Nazis in 1945, because of involvement in a plan to kill Adolf Hitler [10].
For much of his career, Planck held the post of Professor in the University of Berlin. According to Lise Meitner [10], his lectures were "dry, somewhat impersonal, using no notes, never making mistakes, never faltering; the best lecturer I ever heard". Another participant noted "There were always many standing around the room. As the lecture-room was well heated and rather close, some of the listeners would from time to time drop to the floor, but this did not disturb the lecture".
Planck suffered the experience of many discoverers of basic advances in science, in that his fundamental work was not readily accepted. Hence his wry quotation at the head of these articles -- that a discoverer had to wait for establishment detractors to die off, leaving acceptance to the newer upcoming generation.
More about black-body radiation
Around the same time, Wilhelm Wien discovered that the peak of the radiation curve varied with the temperature of the emitting body -- hotter bodies radiated with shorter wavelengths (higher energies). The peak wavelength was inversely proportional to the temperature.

Figure LIUF4. The Wien Law relating temperature and peak radiation wavelength. From [5].
For those wishing to play with the effect of temperature on the radiation curves, there is an applet (graphic calculation tool) at [17]. Here is a sample.

Figure LIUF5. Example from Black-Body Radiation applet. From [17].
While most interest is in wavelengths from the visible spectrum (light), the Planck and Wien laws apply along the whole electromagnetic spectrum. So very-high-energy rays from space, such as x-rays and gamma rays, and low-energy rays such as microwaves, are also covered.

Figure LIUF6. Black-Body radiation applies along the whole spectrum. From [19].
The light which we receive from space comes from the surfaces of stars, which have temperatures of thousands of degrees. Our Sun is at 6000 K (6000 degrees above absolute zero). A heated iron bar gives out light at the lower-energy (red) end of the visible spectrum, though most of its output is in the shorter infrared, which we perceive as radiated heat.
All the objects around us, at "room temperature", also emit continuously, at longer infra-red wavelengths, which we do not normally notice. Most of the time we are close to thermal equilibrium, with heat in balancing heat out. But put us in a refrigerated cold-store, and we soon notice the heat loss, especially without clothes to buffer the heat flows -- an average human body radiates at a surprising one kilowatt.
Finally, coming from all around us in space, the planet receives what is called Cosmic Microwave Background Radiation (CMBR), low-energy radiation from very cold matter in the Universe, only a few degrees above absolute zero. We'll come back to CMBR later on.
Part 2. THE STRUCTURE OF THE UNIVERSE
Stars and Galaxies
Most of our knowledge of the wider Universe has been gained, since earliest times, from observing the stars in the skies. Star charts have been recorded from thousands of years ago, and may even have formed part of ancient paleolithic cave paintings.

Figure LIUF7. We see the Universe as stars and galaxies. From [20].
In recent years, new space-borne telescopes and detectors have extended the wavelengths of detectable matter on either side of the visible spectrum -- into shorter wavelengths (ultraviolet) and longer ones (infrared, radio). But the emphasis has been on visible light.
The information gained on stars and galaxies has been used to work out the masses of different objects, and their distribution. These masses are subject to the gravitational laws developed by Isaac Newton, back in the late 1600s.

Figure LIUF8. Isaac Newton in 1689. From [21].
Newton's Laws of Gravitation provided an excellent explanation of the behaviour of the Universe, and have provided a firm foundation for modern science ever since. But in the 1930s, the brilliant Swiss-American physicist Fritz Zwicky noticed that, for large clusters of galaxies, the conventional Newtonian laws of gravity appeared not to apply.
Apart from being a brilliant and far-seeing astrophysicist, Fritz Zwicky had a big range of other accomplishments. Born in Bulgaria, Zwicky wrote, among many other things, on the Swiss Post Office, and he may have been the first person to put an object into orbit around the Earth, using so-called "shaped charges".
Zwicky's pioneering work on the relationship between masses and rotation speeds of galaxies [22] threw up a big disagreement with classical mechanics. Investigating the Coma cluster, a vast complex of over a thousand galaxies, he found that in order for the cluster to be stable, there must be ten times more mass present than could be directly observed.
This "missing" mass was crucial for keeping the cluster together. If it were not there in some form, the member galaxies would not be bound to one another and would go flying off into space. So in order for the cluster to exist at all, there must be much more mass within the cluster and the individual galaxies than we can directly detect in the form of stars, gas and dust.
When faced with this apparent contradiction, Zwicky shrugged and concluded that the missing mass must just be some cold, dark stuff that doesn't give off much light, so we can't see it directly. He called this non-luminous stuff Dark Matter. He began to investigate other clusters, and found similar results for each of them.

Figure LIUF9. Fritz Zwicky ("Uncle Fritz"). From [22].
Adam Rogers says [22] "The unobservable dark mass, whatever it is, must be extremely important in holding large structures together. There must be a lot of it out there, too -- the Coma cluster alone is almost 90% unobservable by mass. This means that when you look at an image of a galaxy cluster, you are seeing only a small fraction of what's really out there. In fact, Zwicky was the first investigator to uncover a profound cosmic mystery that remains unexplained to this day."
There is more detail on this matter in Refining the Zwicky Constant:
A new more soundly-based constant for inter-galactic distances, replacing the Hubble Constant [21].
This "Dark Matter" hypothesized by Zwicky has been the subject of continued speculation and argument ever since the 1930s. Decades-long searches by astrophysicists for direct evidence of its existence have all ended in failure. The true nature of Dark Matter has only very recently been revealed, and is not yet part of accepted science.
The Oort Soup -- most of the Universe
It is natural enough that astronomers, right from the Babylonians of earlier millennia, have looked first to the stars as their main source of knowledge of the wider universe. Visible light was their domain, other electromagnetic frequencies were unknown to them.
In more modern times, astronomers have gained access to other parts of the electromagnetic spectrum, first radio, then ultraviolet and infrared. But still the main emphasis has been on objects which can be seen, either by their own light or by light reflected from objects quite close to them.
Only in very recent times has it been realized that most of the mass in the Universe cannot be detected by visible light. Instead, it is matter BETWEEN the stars, matter which does not shine by its own light, and is too distant from any star to be detectable by reflected light.

Proposition LIUP1.
This matter is, of course, the Dark Matter suggested by Fritz Zwicky to balance the gravitational picture. But, instead of being some mysterious type of substance not known to science, it is merely ordinary matter, "Oort Soup", a long way from any illuminating star.
Proposition LIUP2.
How the Solar System was formed
It is natural enough that our view of how the Sun and planets were formed has its emphasis in the closer bits that we can see. Newton's deductions of the gravitational laws were worked out from detailed observations of how the planets, and the moons circling around them, moved.
But in fact a solar system like ours takes up only a billionth or less of the surrounding space. Let's look at the scale of these things.
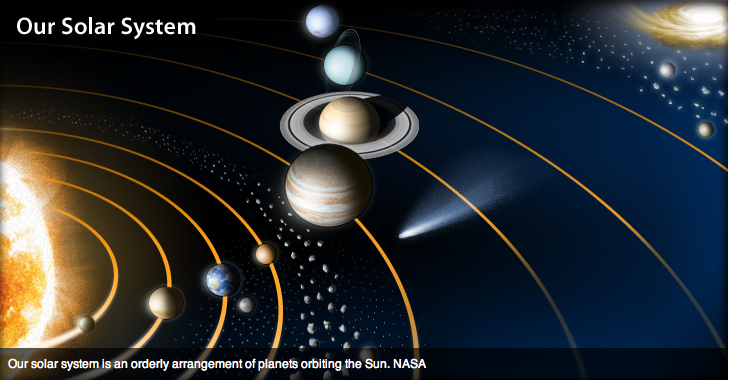
Figure LIUF10. Our Solar System. From [25].
The picture shows the Sun on the left, then the eight planets. Closest to the Sun is Mercury, then Venus, Earth with its Moon, and Mars. After Mars is the Asteroid Belt, then Jupiter, Saturn with its rings, Uranus, and Neptune.
Beyond Neptune lie the outer reaches of the solar system, first a band known as the Kuiper Belt, after that a somewhat random region known as the Scattered Disc, then a vast almost-unknown region called the Oort Cloud, which sends us an occasional comet. Passing through the Oort Cloud, we eventually reach the domains of other stars, and, hugely more distant, other galaxies.
For distances within the Solar System, it is convenient to use AU units -- 1 AU (Astronomical Unit) is the average distance from the Earth to the Sun. So we are at 1 AU from the Sun, Jupiter is 5.2 AU, Saturn 9.6 AU, and Uranus 19.2. Neptune, the outermost planet, is just over 30 AU from the Sun.
Beyond Neptune, the Kuiper Belt is reckoned to extend from 30 to 50 AU out, and beyond that, the Scattered Disc out to the maximum distance of about 100 AU.
There is more detail on this in The Cosmic Smog model for solar system formation, and the nature of 'Dark Matter' [26]. Relevant points are, that the inner planets lie almost in a plane, the 'ecliptic', which is more or less the same as the plane of the Sun's equator.
Objects in the Kuiper Belt have orbits about the Sun which are appreciably inclined to the ecliptic (tilted out of the plane of the Sun's rotation), and the further from the Sun, the more inclined is an object's orbit. Finally, by the time the outer (100 AU) surface of the 'Heliosphere' is reached, orbits are randomly inclined to the ecliptic.
Most of the objects we know of which come from the Oort Cloud, surrounding the 100 AU 'Heliosphere', are comets. These long-period comets come in at any angle to the ecliptic, and their orbits may be 'retrograde', moving in the opposite sense to the planets. The famous Halley's Comet does this, passing through the Solar System in the opposite way to the planets.

Figure LIUF11. Components of the heliosphere. From [27].
What it comes down to is that the 'Heliosphere' is the effective outer limit of the Sun's influence. Gravitational forces on objects outside the Heliosphere are no longer dominated by the Sun's gravity, but by the influence of other masses -- these objects do not orbit about the Sun.
Proposition LIUP3.
Makeup of the Oort Soup
Older views of the formation of the Solar System often assumed that the Sun was formed first, and that the planets condensed from a "protoplanetary disc" of matter which somehow formed around the new star. This is why it was supposed that the planets orbit almost in the ecliptic plane.
When it comes down to it, however, there is very little to show why such a disc would be formed, or why it should orbit in the ecliptic plane. There is an attractive pseudo-parallel in a wet spinning-top, which on rotating will throw out drops of water from its periphery. But there have been no plausible mechanisms shown, by which a star like the Sun would throw out material equatorially as it rotated. Conversely, a star tends to accumulate matter from its surroundings, due to its high gravitational attraction.
In the current picture, the Oort Cloud within which our Solar System sits is made up of planetesimals, aggregated bodies of every size, mostly consisting of ice and dust. During the last decade we have been able to analyze such material from the nuclei of comets, acknowledged to originate in the Oort Cloud. Comet-nucleus material is very open and friable, with only one-fifth of the density of ice.
The Oort Soup planetesimals exist in a vast range of sizes, from dust up through the size of asteroids, small and large planets, and to a little less than the mass of the smallest star.
Planet-sized bodies very distant from stars are extremely hard to detect, but they do exist -- they are called "rogue planets". According to Wikipedia [30], there may be billions of rogue planets within our galaxy. Some, at almost the mass of a star, have been called "Sub-brown Dwarfs". These do not produce visible light, but may radiate in the infrared.
Very occasionally, in some part of the Oort Cloud, enough planetesimals aggregate in one spot to reach the mass of a small star. With enough mass, a proto-star can undergo what's called ignition -- it becomes dense enough at its centre for hydrogen to start the process of fusion into helium. The star becomes hot enough to begin radiating light, and so becomes visible to astronomers.
Formation of planets in the current model is totally different to the old protoplanetary-disc idea. Instead of a star forming first, and then gaining planet-formation material around it, the new star forms in the middle of a random selection of Oort Soup material. Again, there is more detail on this in The Cosmic Smog model for solar system formation, and the nature of 'Dark Matter' [26].
It should be noted that the "Oort Cloud" is not really a defined volume, it is just the term used for the space beyond the 100 AU Heliosphere. Working just around our own star, we can certainly include space out to 1000 times the radius of the Heliosphere -- 100,000 AU is about 1.58 light-years, less than half the way to the nearest star, Proxima Centauri, at 4.24 light-years.
Equatorial Forcing around celestial bodies
All stars rotate, and it appears that an as yet little-investigated gravitational mechanism exists which encourages randomly-moving planetesimals nearby to fall into orbit around the star, and then slowly regularize their orbits so that they lie in the ecliptic plane, the star's equatorial plane of rotation. Here this is called "Equatorial Forcing".
The puzzle as to why the orbits of planets lie in a plane, while those of comets do not, was noted as far back as 1730 by Isaac Newton [38], and has had to wait over 280 years until now for a solution. Newton says (p.369) "Whence is it that Planets move all one and the same way in Orbs concentrick, while Comets move all manner of ways in Orbs very excentrick?".
Obviously this Equatorial Forcing will be a very tumultuous process. Many planetesimals will fall into the star, increasing its mass and so its gravitational attraction for other planetesimals. Orbits at random inclinations to the ecliptic will compete, until the slight gravitational favouring of ecliptic-oriented movement will eventually bring most planets into the same plane.
During this process, collisions will be very frequent, as previously random paths are brought into a single plane. There is strong evidence for such a process in what's called the Late Heavy Bombardment.
Here is how Wikipedia describes it [28]: "The Late Heavy Bombardment is a hypothetical event thought to have occurred approximately 4.1 to 3.8 billion years ago. During this interval, a disproportionately large number of asteroids apparently collided with the early terrestrial planets in the inner solar system, including Mercury, Venus, Earth and Mars. The LHB happened "late" in the Solar System's accretion period when the Earth and other rocky planets formed and accreted most of their mass; it is a period still early in the history of the solar system as a whole."
The Equatorial Forcing postulated will obviously be a slow and gradual process, strongest closer to a parent star, and weaker and slower further out. The Earth and Solar System are reckoned to be about 4.7 billion years old, so it would be about 600 million years before forcing started, and another 300 million years before it was completed, if the Late Heavy Bombardment figures apply.
There are other examples of Equatorial Forcing at work. One of the most complete is seen with the Rings of Saturn, first noted by Galileo in 1610 with his new telescope, and undoubtedly one of the most stunning objects in the heavens.

Figure LIUF12. The Rings of Saturn. From [29].
A lot is now known about these rings. There are mostly made of ice particles, ranging from 1 centimetre to 10 metres across. Up to some 160,000 km in diameter, and 10 m thick, they are probably one of the flattest objects in the Universe -- 16 million times as wide as they are thick.
But how or why did these rings form? Yet another current mystery. According to a NASA website [29], "scientists aren't sure when or how Saturn's rings formed".
Tellingly, the rings rotate exactly above Saturn's equator. While the mathematics of the process may need development, they are a clear example of what is here called 'Equatorial Forcing'.
Similar, but much less spectacular, rings have also been found around the other giant planets, Jupiter, Uranus, and Neptune. These rings also rotate directly above their planet's equator. There is more detail on this in [27].

Proposition LIUP4.
Our entire galaxy, the Milky Way, may be another example of Equatorial Forcing. At the centre of our galaxy lies a supermassive, rotating black hole of some 6 million solar masses. Could it be that typical spiral galaxies like ours develop by converting their initial globular shape to that of a flat disc through Equatorial Forcing?
Density and Mass in the Oort Cloud
In the current picture, the whole of the Universe is populated by a thin, but fairly uniform, distribution of planetesimals. In some places, enough planetesimals have aggregated to reach the mass of a star. Over some billions of years, the star regularizes the orbits of planetesimals within its gravitational reach, or absorbs them into its own mass.
The situation is then as in figure LIUF11 above, Components of the heliosphere. Within the star's heliosphere, most matter is aggregated into planets, with equatorial forcing bringing their orbits close to that of the star's equator. Beyond the surface of the heliosphere, Oort Cloud bodies ("Oort Soup") are largely unaffected by the star's gravity.
There are some important consequences of this reasoning.
1. As the star has brought most matter within the heliosphere into its equatorial plane, the space above and below this plane is depleted in matter -- the space above and below the heliosphere plane is among the least populated, the least dense, in the Universe.
2. The density of the Oort Soup outside all heliospheres will be roughly uniform. Since a heliosphere is formed by hollowing-out, aggregating, and forcing all the matter within its boundary, density of the general Oort Soup will be of the same order as the density of a solar system.
3. Most of the mass of the Universe will therefore lie in its undifferentiated Oort Soup, rather than in its solar systems. In the case of our own Solar System, if its heliosphere has a radius of 100 AU, within an Oort Cloud sphere of radius 100,000, the Oort Cloud sphere has a volume a billion times that of its contained heliosphere, and thus a mass of up to a billion times that of the Solar System.
Proposition LIUP5.
While this mass figure is an upper limit, the undifferentiated Oort Soup is the obvious candidate for the Dark Matter searched for over so long a period by astrophysicists.
The fact that the Heliosphere volume above and below the equatorial plane is a very good vacuum, suggests a way of creating a large evacuated space in the Universe. Insert a rotating star, and wait a billion years or so, and the star will clear the space for you.

Figure LIUF13. The Oort Soup surrounding our Solar System. From [14].
Let us go on now to look at how the Oort Soup makes its presence known to us on Earth.
Part 3. THE ORIGIN OF CMBR
We know that Oort Soup matter is not detectable by its own light, as it is too cold to emit at visible wavelengths, and it is not detectable by reflection of starlight, as it is too distant. But it must be detectable by the normal thermal or black-body radiation it gives off, most of which will be in the infrared and microwave bands.
It seems hardly controversial to think that this radiation must be the same as the Cosmic Microwave Background Radiation which puzzled radio astronomers when it was discovered, and led them to a false idea about its origin. Those who cling to this false idea have to come to terms with the fact that, according to standard physics, radiation just like CMBR must be produced in the Oort Cloud.
To delve back into the history, Cosmic Microwave Background Radiation, CMBR, was discovered accidentally in 1965 by Arno Penzias and Robert Wilson at the Bell Telephone Laboratories in Murray Hill, New Jersey. For this, they won a Nobel Prize.
Penzias and Wilson were investigating microwave radio emissions from the Milky Way and other natural sources [31], using a large horn-shaped antenna. When the two scientists tuned their equipment to the microwave portion of the spectrum, they discovered an annoying background static that wouldn't go away.

Figure LIUF14. The Holmdel, N.J., horn antenna on which Penzias and Wilson (seen in the photo) discovered the cosmic microwave background radiation in 1965. From [36].
No matter where they pointed the antenna, or when, the microwave static was the same. They spent months running down every possible cause for the static, including pigeon droppings inside the antenna, but they couldn't find a source or a solution [32].
Eventually they realized that this radiation came from the sky, in fact from everywhere in space. It is primarily in the microwave portion of the electromagnetic spectrum, and is invisible to the naked eye. It fills the universe and can be detected everywhere we look. In fact, if we could see microwaves, the entire sky would glow with a brightness that was astonishingly uniform in every direction [31].
The Universe is awash with radiation of various kinds -- we are most aware of that from the Sun, and at night, that from the stars. But some 70% of the radiant energy flooding through the Universe is CMBR, and because it is of much lower energy than light, it makes up an even higher fraction of the electromagnetic quanta -- around 95% [41].
To give the "astonishingly bright, uniform glow" mentioned in [31], the CMBR must be coming from all around us. It will be almost self-evident, that its source is the Oort Soup we have been examining.
Proposition LIUP6.
Later on, we'll analyze some of the properties of CMBR from this viewpoint. But it has to be stated, that this viewpoint differs markedly from the current "establishment" view, which is based on two fairy stories.
Fairy stories about the Universe
The first fairy story is the "Big Bang Theory", which purports to describe when and how the Universe formed, and its subsequent history since that time. Rather than being a proper scientific theory, based on evidence and logic, "Big Bang" is just one among a hundred or more Creation Myths.
No professional scientist should accept the Big Bang Theory, because if it was true, it would violate one of the basic laws of physics, the Law of Conservation of Mass/Energy. In reality, no instance is known where this law is not obeyed -- so anyone continuing to believe in Big Bang should be prepared to explain this violation.
There is a lot more to the matter, those interested in all the details might like to look at R.I.P. Expanding Universe (b. 1930, d. 2012): (The Big Bang never happened), at [37].
The second fairy story is about where all the CMBR radiation comes from. According to the official story, it comes from optical wavelength (light) radiation, created after the "Big Bang". Expansion of the Universe "stretched" all this Big Bang radiation to microwave wavelengths, and that is where CMBR originates.
Really, this is fantasy. If expansion of the Universe really had happened, and it stretched the Big Bang optical radiation down to microwave, why didn't it stretch other early optical radiation too? How could such stretching result in the very narrow bandwidth observed for CMBR? Why is CMBR observed coming from all directions in the sky? How come it is magically preserved over the supposed 13.7 billion years of the Universe, and not absorbed like other radiation?
And then there is the problem that the Big Bang itself never happened. Assuming CMBR originates from the Oort Soup pervading most of the Universe eliminates all the above difficulties.
What do we really know about CMBR?
We know a lot about the spectrum of CMBR, the shape of the curve of natural CMBR intensity plotted against its wavelength. Almost all the CMBR detected falls in the 0.5 to 10 mm range, with a strong peak a little above the 1 mm wavelength.

Figure LIUF15. Microwave data from the COBE satellite. From [39].
Following the original discovery of CMBR, and the development of spacecraft, several satellites were placed in space specifically to detect and measure the radiation. These included COBE, the Cosmic Background Explorer [40], and others. The shape of the CMBR spectrum was defined with good accuracy.
We already know that there is a relationship between the temperature of a body emitting radiation, and the wavelength of the radiation emitted, as Max Planck demonstrated. The COBE data matched very closely with that expected for very cold matter at only a few degrees above absolute zero. The radiation peak was consistent with thermal radiation from very cold matter, at about 2.7 K. In [34], talking about the Oort Cloud, it says, "Being so very far away from a heat source, our sun, the temperature could be as low as 3K".
It might be thought obvious to look for the source of CMBR in just such matter, as the Oort Soup is distant from any star and thought to be at temperatures of 3-5 K [34]. But the existence of this Oort Soup was not known at the time. Hence the lurch into the wild-goose chase of "radiation left over from the Big Bang".
There is more detail on the discovery and mis-identification of CMBR in The Oort Soup as the real origin of Cosmic Microwave Background Radiation, at [33].
Variation in CMBR over different parts of the sky
Although the CMBR radiation received from all parts of the sky is very similar, there are very slight variations in the peak wavelength at different points.
This variation, technically called anisotropy, is explained in more detail in [2].
The COBE satellite was one of the first probes specifically intended to detect CMBR. It showed a CMBR peak at a wavelength equivalent to a temperature of 2.725 K. From a later probe, called WMAP (Wilkinson Microwave Anisotropy Probe), the tiny variations from this peak in different parts of the sky were plotted.

Figure LIUF17. Variation in CMBR wavelengths from WMAP data. From [2].
In the above and the following figure, the ovals are maps of the entire celestial sphere in an equal-area Mollweide projection. The long axis is the plane of our galaxy, the Milky Way. To demonstrate the use of this projection, [2] has a topographical map of the Earth in this projection, showing that there is no part of the Earth that is not included in the oval, and similarly there is nothing "outside" the WMAP map.
The Mollweide maps have each been processed and adjusted to remove signals from other sources so that they show only the tiny anisotropy, the tiny variations from the 2.725 K CMBR peaks. On the above figure, the variations between red and blue represent a temperature difference of only 0.00335 K, less than one-thousandth.
The WMAP probe was put into space by NASA, the US government agency. A more recent space observatory, called the Planck Mission (named in honour of Max Planck), was operated by the European Space Agency (ESA) from 2009 to 2013.
Planck mapped the anisotropies of the CMBR at microwave and infra-red frequencies, with high sensitivity and small angular resolution. The mission substantially improved upon observations made by the NASA Wilkinson Microwave Anisotropy Probe (WMAP) [13].
Planck's first image of the sky, completed in July 2010, showed plumes of gas and dust extending thousands of light years above and below our galaxy, and "a glimpse of light emitted shortly after the birth of the Universe".

Figure LIUF18. Planck's first image of the microwave sky. From [13].
The Planck observatory is not in orbit about the Earth. Instead, it orbits the Sun at a gravitationally neutral position about 1.5 million kilometres beyond the Earth, called the L2 Lagrange Point.

Figure LIUF19. The L2 Lagrange Point. From [42].
According to [13], "Planck provided a major source of information relevant to several cosmological and astrophysical issues, such as testing theories of the early universe and the origin of cosmic structure; as of 2013 it has provided the most accurate measurements of several key cosmological parameters, including the average density of ordinary matter and dark matter in the Universe".
All these well-justified but highly expensive projects have provided a wealth of data, but the potential analysis and exploitation of this data has been stultified by the erroneous assumptions about the origin of CMBR noted above. Namely, that CMBR originated from the Big Bang, and has been floating around the Universe ever since.
Now we have the concept that CMBR is just standard thermal emission from components of the Oort Soup, let us go on and try to derive a whole new range of conclusions from this data.
Part 4. MINING THE CMBR DATA
What the CMBR spectrum tells us
With the old concept that CMBR was derived from a "Big Bang" billions of years ago, analysis of data from the Planck observatory and its predecessors necessarily could only tell us something about the whole Universe, a long time ago.
With the new concept that CMBR comes from real objects in the present-day Universe, we can start deriving a lot more about these objects. We can start with the CMBR spectrum.

Figure LIUF20. The CMBR spectrum. From [3].
This spectrum is almost exactly the same, whatever direction in the sky we look. This uniformity might lead to the assumption that CMBR comes from a single, uniform source. This turns out not to be true.
We can see from the figure that the CMBR peaks at a wavelength of around 2 mm, and we know that this wavelength is what would be expected from cold matter at a temperature of about 2.725 K, less than 3 degrees above Absolute Zero. Does this imply that CMBR comes just from matter at this temperature?
It does not. The CMBR curve is a composite, made up of thermal radiation from all over the Universe. The 2 mm peak only tells us that this is the most common wavelength being received, the actual curve is made up of the sum or aggregate of all such radiation, the vast majority of which arrives with a wavelength between 0.5 and 5 mm.
The position may be made clearer with an example from another area, the area of the heights of human beings. If you measure the heights of large samples of men and of women, and plot the numbers at given heights, you get curves like those shown in the following figure.

Figure LIUF21. Heights. From [35].
Both these curves approximate to what are called Normal or Gaussian distributions, popularly known from their shapes as Bell Curves. You can see that in the population which was sampled to give these curves, the most common height for women was about 162 cm, while the peak for men was about 178 cm.
Notice that although both curves are similar in shape, the one for women is taller and not so broad, the men's one is wider and has a lower peak. This just means that the variation in men's heights is greater than that of women, so the whole "male" curve is squashed down and out compared to the "female" one.
It is a feature of these Bell Curves that they can be combined, and if they are, it gives another Bell Curve. This logically must be so, as the combined curve is the height frequency curve for adults, men plus women. For a given height, add the value of the blue dot to the value for the pink dot -- if you plot that, you get a single bell curve with a peak twice that at the 170 cm cross-over point.
If you make a plot for a sub-set of the population, say only left-handed women over 40, you will get another bell curve, provided the number sampled is large enough. So sub-set bell curves add together to give another bell curve.
Back to the CMBR spectrum
In the same way the CMBR curve can be considered as made up of a huge composite of sub-set CMBR curves originating from all over the Universe. These curves are not Bell Curves, but they will all have similar, and additive, shapes. This is because they are all defined by the same Planck Law. Their peaks may lie at different wavelengths to the 2.725 K, 2 mm peak shown, but in combination they will meld together to give that peak.
Under these conditions, we might hope to isolate particular CMBR sub-set curves, but this is made difficult by the sheer volume of radiation coming in, and the fact that average conditions are much the same for all sky directions.
Physical basis of the CMBR curve
Going back to the CMBR curve at LIUF20, we can assume that the 2 mm peak is due to cold Oort Soup bodies at a median temperature of 2.725 K. Populations to the right of the peak, at shorter (higher energy) wavelengths are then due to matter warmer than 2.725 K, and populations to the left are due to matter cooler than that at the peak.
Why should some of the Oort Soup bodies be hotter than average, and some cooler? The explanation is in their average distance from their closest stars. Warmer parts of the spectrum come from bodies closer to stars, and cooler parts from bodies more distant from hot sources.
Proposition LIUP7.
Most of these Oort Soup bodies will be in thermal equilibrium. They will be in continuous receipt of all sorts of radiation from other bodies in the Universe, including CMBR from other bodies, and a bit of starlight from nearby stars. Energy received will be continuously converted and re-radiated as CMBR at the wavelengths appropriate to their temperature.
It is a feature of the energy they radiate, that its wavelength depends only only on their temperature, which in turn depends on their distance from the nearest stars (except for larger bodies with internal heat, to be mentioned later).
We can see that on moving in the Oort Cloud further and further away from a star, greater volumes of materials at lower and lower temperatures will be met with. This is equivalent to climbing up the LIUF20 curve from the right-hand side.
Why then is there a peak, after which the amount of radiation falls away, as you move down to the left? This happens because as you move very large distances from the star, you begin to receive energy from other stars. So the CMBR peak directly reflects the median distance of Oort Soup matter from stars or other energy sources.
Distances, temperatures, and masses of Oort Soup bodies
It is fairly easy to calculate the temperature that a planet or other body should be at, if you know its distance from its parent star, and how much energy that star radiates. This so-called "effective temperature" has been worked out for some of the planets in our solar system.

Figure LIUF22. "Effective Temperatures" for some planets. From [44].
It is relevant that the temperatures depend only upon the distance of the planet from the Sun, and not upon the size of the planet. For those interested, the formula needed is given in [44].
The table lists the effective planetary temperatures expected for the four terrestrial planets if they had no atmosphere, were ideal radiators and were rotating with a period measured in no more than a few tens of hours.
The actual surface temperatures of planets are higher than the ones calculated using the standard formula. Apart from the factors already mentioned, the planet may be generating its own heat internally, as is the case for Earth.
The formula applies at any distance from the star, and so can be used to calculate the distance implied by a given emission temperature. A useful calculator built in to the Hyperphysics page [19] gives the equivalent temperature for a given wavelength based on the Planck Law.
If this is used for four wavelengths listed under the CMBR spectrum at Fig. LIUF20, namely 0.2, 0.1, 0.07, and 0.05 cm, the respective temperatures are 1.45, 2.90, 4.14, and 5.80 K.
If the formula listed in [44] is used to calculate the equivalent distances from our Sun for these to be "effective" temperatures, these work out at 52.40, 13.10, 6.43, and 3.27 light years.
Now these results are very probably not reliable, as they take no account of a number of possible disturbing factors, and may be extrapolating formulas well beyond the circumstances for which they were derived. But they give a new, and fairly credible, picture of what is happening with CMBR.
This picture says that Oort Soup bodies need to be about 3.2 light years from stars like the Sun before they are cool enough to emit the shortest-wavelength observed CMBR, and as their average distance from stars becomes greater, at 6.4 and 13.1 light-years (moving up the curve, from right to left), their total CMBR emission rises.
The peak of the curve works out to be equivalent to about 14.8 light-years. This is the figure for the median, the most popular position, of Oort Soup bodies, at 2.725 K. Beyond this, at 52.4 light years and above, the amount of such bodies becomes increasingly less.
As with all electromagnetic radiation being propagated through the Universe, the amount of CMBR received falls off as the square of the distance of the source. So CMBR received from Oort bodies 20 light-years away will have fallen to a quarter of the intensity of bodies 10 light-years away. Conversely, there will be four times as many such bodies, on average.
As mentioned, all these figures will be relatively unreliable, and criticism of particular values given may well be justified. But this is to be expected in the first tentative steps into a new field.
Olbers' Paradox
We have enough information now to offer a solution to the so-called "Olbers' Paradox".
Olbers' Paradox, described by the German astronomer Heinrich Wilhelm Olbers in 1823, is the paradoxical observation that the night sky is dark. But in an infinite universe, the night sky ought to be bright, as no matter in which direction you looked, you should eventually come up against the light from a star. This paradox is sometimes also known as the "dark night sky paradox".

Figure LIUF23. Olbers' Paradox. From [49].
The first point is that, even if it is true that wherever you look you will be in line of sight with a star, it doesn't mean that the star emits enough light for you to be able to detect it at long distance. The perceived intensity of the star's light falls away as the square of its distance from you, and for a distant star, it soon becomes undetectable.
This holds even if you resort to mechanical detection, such as with long-exposure telescope film plates, or counting light quanta with charge-coupled devices. The Hubble Space Telescope has been able to detect galaxies more than 13 billion light-years away, with its Deep Field project. But these galaxies still show as diffuse points in a dark field.
The second point is that when we talk about light, we mean only that small part of the electromagnetic spectrum that our eyes have evolved to register. Suppose our eyes could see that part of the spectrum which includes CMBR. This "fills the universe and can be detected everywhere we look. In fact, if we could see microwaves, the entire sky would glow with a brightness that was astonishingly uniform in every direction [31]".
So there would be no Olbers' Paradox if our eyes were equipped to register microwaves. This is a reflection of the universal distribution of the Oort Soup bodies producing CMBR throughout the Universe.
Mass of Oort Soup bodies
There is the temptation to try and calculate the mass of Oort bodies from the amount of CMBR received at a given point. However, there is a real difficulty here.
Planck's law gives the amount of radiation from unit area of a radiating body. In practice, this will depend on its size, the extent to which it is aggregated.
For example, assuming other factors to be equal, a spherical Oort body 200 km across will have four times the surface area of one 100 km across, and 8 times the mass. So the radiation produced per unit of mass in the larger body will be only half that of the smaller body. The amount of CMBR produced in the Oort Soup has no simple direct relationship to its mass.
Conformations of Oort Soup bodies
On of the surprises from recent advances in astronomy has been the great diversity of structures discovered. Not only many double, triple, and higher-multiple stars in all manner of relationships, but many exoplanets (planets around stars other than the Sun) in solar systems nothing like our own.
For example, some stars have giant planets, bigger than Jupiter, orbiting closely around them in a few days -- conformations totally inconsistent with older ideas of solar-system formation. Some of these are so close to their star that they are believed to be in process of absorption by their star.

Figure LIUF23. A hot Jupiter being ingested by its host star. From [45].
Closer to home, the dwarf planet Pluto has been found to have an exotic arrangement of moons around it.
Once classed as the Sun's ninth planet, Pluto has been demoted to a "dwarf planet", one of four or more small but significant bodies in the Kuiper Belt and the Scattered Disc. In 1978, Pluto was discovered to have a moon, Charon, which was quite large compared to Pluto -- in fact, the common centre of gravity about which Pluto and Charon orbit is outside Pluto's surface.
This makes Pluto and Charon a double planet. Earth, also, has a Moon which is quite massive compared to itself, but the common centre of gravity is still about 1700 km below its surface.

Figure LIUF24. Pluto, Charon, and moons. From [46].
In recent years, more and more tiny moons have been discovered around Pluto. These too orbit around the Pluto-Charon centre of gravity, but are well beyond Charon, and so orbit around the double dwarf planet.
All these things are a pointer to the fact that the classical arrangements of orderly planets orbiting around a central star are not necessarily likely to be the only arrangements found in the wider Universe.
Sub-Solar Systems
Within the Oort Soup, it seems quite likely that the normal aggregation processes and effects of gravity will lead to formation of what may be called "Sub-solar systems", arrangements in which some quite massive bodies have retinues of other bodies orbiting around them.
These bodies may have many times the mass of Jupiter, which is the most massive planet in the Solar System, but is still less than one-thousandth the mass of the Sun. The upper limit for such bodies is when they approach the bottom of the Red Dwarf range -- red dwarfs are the smallest stars, the least massive bodies to shine by their own light.
According to Wikipedia [47], "A red dwarf is a small and relatively cool star on the main sequence, either late K or M spectral type. Red dwarfs range in mass from a low of 0.075 up to about 0.50 solar masses, and have a surface temperature of less than 4,000 K.
Red dwarfs are by far the most common type of star in the Milky Way, at least in the neighborhood of the Sun, but because of their low luminosity, individual red dwarfs cannot easily be observed. From Earth, not one is visible to the naked eye. Proxima Centauri, the nearest star to the Sun, is a red dwarf, as are twenty of the next thirty nearest. According to some estimates, red dwarfs make up three-quarters of the stars in the Milky Way."
So in a mass scale where Jupiter is 1 J, red dwarfs range from 75 to 500 J. Oort Soup bodies could be as large as 70 J (70 times the mass of Jupiter), and still not be massive enough to give rise to light-producing processes.
Internal heat of Oort Soup bodies
Even though sub-stellar Oort bodies do not produce light, they will have internal processes which produce heat, which will be radiated off as infrared. CMBR actually spans the boundary between microwave and infrared energy (see Fig. LIUF6 above), with infrared having shorter wavelengths (higher energy) than microwaves.
In our Solar System, the larger planets all produce heat internally, with the amount of internal heating increasing with the mass of the planet. Jupiter, the largest planet, makes as much heat from internal processes as it receives from the Sun. This gives Jupiter an average temperature some 40 degrees C above its effective temperature (that from solar radiation alone) [44].
What is the origin of this internal heat? Scientists are still arguing over this, but in my view it is due to the very slow decay of compacted-core neutrons formed at the time of aggregation of such Oort Soup objects. More details on this can be found at Inside The Earth -- The Heartfire Model [48].
Whatever the origin of this internal heating, it happens with bodies above a certain size, around the mass of Mars and above. According to [48], Mars had enough mass and compacted neutrons at the time of its formation to generate internal heat for about a billion of its 4.7 billion years. After the billion years, the compacted neutrons were all used up, and internal heating ceased.
Mars has only about three ten-thousandths of the mass of Jupiter. It can be expected that anything formed in the Oort Soup with a mass of 0.001 J or above will still be producing internal heat, detectable as infrared. So all Oort Soup objects with masses of 0.001 to 70 times the mass of Jupiter should produce infrared, wherever in the Soup they are situated.
Of course the greater their mass, the higher their rate of internal heat production, the higher their equilibrium temperature, and the shorter the wavelength of their infrared radiation. Oort Soup bodies can be expected to exist which radiate everywhere in the range above CMBR and below visible light.
Looking again at the LIUF20 CMBR spectrum, for a given direction in the sky, these bodies should be detectable as tiny individual infrared peaks off to the right of the curve, where the general Universe-filling CMBR has ceased. In other words, with a powerful infrared telescope, they should look like stars -- point sources, but viewed in infrared rather than visible light.
All the techniques currently used to detect distant stars and galaxies, such as long-exposure photographic plates or CCD detectors, should be usable with appropriate-wavelength telescopes to detect Oort bodies as point objects.
Where a sub-solar system has been formed, with some bodies in orbit about a larger one, it might be possible to map out the system using Doppler shifts -- the "sub-sun" would be radiating at shorter infrared, its "sub-planets" at longer infrared, with subtle shifts in their radiation peaks according to their positions in orbit.
Part 5. SO, WHERE ARE WE AT?
Two major innovations in Science
This article represents two major innovations in Science, one of content, and one of manner.
In content, the article brings together, for the first time, a number of solutions to old questions and a new view of much of the physical Universe.
Perhaps the most prominent is the elucidation of Dark Matter, a subject which has intrigued physicists for more than 80 years. Coupled with this is the very logical explanation of the source of CMBR, Cosmic Microwave Background Radiation, correcting an erroneous idea dating from 1965.
Then there is the explanation of the contents of the Oort Soup, the vast volume which fills most of the Universe apart from the obvious stars, and which for our Solar System is called the Oort Cloud.
As an incidental to this, the phenomenon here called Equatorial Forcing is brought out to explain why our planets travel in a plane, and why the rings of Saturn have their shape.
This leads to an explanation of what caused the Late Heavy Bombardment, a puzzling occurrence in the early history of our Solar System.
A new and more logical explanation is given of How Solar Systems Form, by aggregation of bodies from the Oort Soup.
A new view of the Distribution of Mass in the Universe is given, where the masses of stars and other galactic objects make up only a lesser part of the total.
An introduction is given to why the Big Bang Theory is Wrong and a link is given which explains this in more detail.
New techniques are suggested for Analyzing Oort Soup Bodies, using the three or four infrared bands of electromagnetic radiation.
Links are given to more detailed Stablemate Articles explaining matters such as the Expanding Earth, the origin of Planetary Internal Heat, the formation of Heavy Elements, and the formation of Compacted-Neutron Cores.
Straight onto the Internet
The second innovation in this research is the way it is being released. This article is the first occasion on which a major advance in science has its first release direct onto the World Wide Web.
This had immediate advantages: the work is available immediately, without cost, to anyone with access to the Web, anywhere in the world.
It can also be commented on or referred further by anyone with interest in the matters outlined. A facility given below for direct comment can be used to applaud, or note errors, or point to passages which are not clear.
The established scientist might also comment that this method of release dodges the careful analysis and exclusion of wild speculation which the standard procedure of publishing and review offers. That is fair enough. But a factor concealed in this view is that the "Standard Filter" is not equipped to handle major new results which are in conflict with the status quo.
I have claimed that this sort of release direct onto the Web is new. However there are parallels in the past, where innovate results were stifled by the establishment. Let's look at one of these.
Edwin Hubble and the Red Shift
Most people will have heard of Edwin Hubble, for whom the Hubble Space Telescope was named. Many will know of his discovery that lines in the spectra of distant galaxies showed a red shift, and that this shift was greater, the further away a galaxy was.

Figure LIUF25. Edwin Hubble. From [52].
Almost everybody with an interest in the Cosmos will have heard of the Big Bang Theory, according to which the Universe is expanding, created from an infinitesimally small point some 13.7 billion years ago. It's also quite common to read, in books and newspapers, that Hubble discovered in 1924 that the Universe was expanding.
This latter statement is quite untrue. It is true, that Hubble discovered the red shift of distant galaxies, and it is true, that proponents of the Big Bang Theory seized upon this fact and claimed that it meant that the galaxies were receding away from us. But Hubble himself, to the end of his life, never accepted that the red shift meant the galaxies involved were receding [52].
But what is interesting, from the present viewpoint, is how Hubble's new results were obtained and released. Hubble's arrival at Mount Wilson Observatory, California in 1919 coincided roughly with the completion of the 100-inch (2.5 m) Hooker Telescope, then the world's largest [52].
His observations, made in 1922-1923, proved conclusively that these nebulae were much too distant to be part of the Milky Way and were, in fact, entire galaxies outside our own. Hubble himself, then 35, was still a relatively young scientist.
When Hubble came up with the red-shift data, his results were effectively suppressed by senior figures in the astronomy world, especially the venerable Harlow Shapley at Harvard University. These older figures had considerable influence over the editors of astronomical journals.
To dodge this establishment blockade, Hubble had his findings first published in a newspaper, the "New York Times" of November 23, 1924 [52]. Once the cat was out of the bag, the editors had no reason to exclude him. In the end, Hubble's work was presented at a 1925 meeting of the American Astronomical Society.
Niels Bohr and the structure of the atom
Niels Henrik David Bohr (7 October 1885 - 18 November 1962) was a Danish physicist who made foundational contributions to understanding atomic structure and quantum theory, for which he received the Nobel Prize in Physics in 1922. Bohr was also a philosopher and a promoter of scientific research [53].

Figure LIUF26. Niels Bohr. From [53].
In [53] it notes: "Bohr developed the Bohr model of the atom, in which he proposed that energy levels of electrons are discrete and that the electrons revolve in stable orbits around the atomic nucleus but can jump from one energy level (or orbit) to another".
Bohr founded the Institute of Theoretical Physics at the University of Copenhagen, now known as the Niels Bohr Institute, which opened in 1920. Bohr mentored and collaborated with physicists including Hans Kramers, Oskar Klein, George de Hevesy and Werner Heisenberg. He predicted the existence of a new zirconium-like element, which was named hafnium, after the Latin name for Copenhagen, where it was discovered. Later, the element bohrium was named after him.
During the 1930s, Bohr helped refugees from Nazism. After Denmark was occupied by the Germans, he had a famous meeting with Heisenberg, who had become the head of the German nuclear energy project. In September 1943, word reached Bohr that he was about to be arrested by the Germans, and he fled to Sweden. From there, he was flown to Britain, where he joined the "British Tube Alloys" nuclear weapons project, and was part of the British mission to the Manhattan Project.

Figure LIUF27. The Bohr model of the Atom. From [50].
According to [51], "Bohr made fundamental contributions to understanding atomic structure and quantum mechanics. Bohr has been described as one of the most influential scientists of the 20th century".
He proposed his atomic model in 1913, subsequently perfecting it and showing its immense predictive power. As an entrepreneur, he established his Institute for Theoretical Physics in 1921, making it the Mecca for the younger generation of physicists from all over the world pursuing the implications of the quantum, under the guidance of their leader and teacher, Niels Bohr. As a philosopher and teacher, he was the principal person in formulating the "Copenhagen Interpretation" of quantum mechanics, incorporating the complementarity concept, which to Bohr had implications far beyond physics."
From 1933 to 1940, he made his institute into a temporary haven for young physicists no longer welcome in Germany for reasons of race or politics. After his escape from Nazi-occupied Denmark in October 1943, he contributed to the development of the atomic bomb in America. At the same time, he pursued his own mission to convince British Prime Minister Winston Churchill and the American U.S. President Franklin D. Roosevelt that they should inform the Soviet Union of the atomic bomb project in order to avoid a nuclear arms race after the war. After the war, Bohr continued his efforts for what he called an "Open World", as evidenced, for example, in his Open Letter to the United Nations from 1950.
Bohr was not in conflict with the establishment in releasing his results, but, like Max Planck, he was rueful about the difficulties and slow rate of acceptance of new discoveries. The following quotation is attributed to him.

Quotation LIUQ2
For the Reader
The Bohr quotation echoes, rather more succinctly, Planck's quotation at the head of this article. It is left to the Reader to ask themself, "Would my demise advance science, or am I already on the side of reason?".
* * * * * * * * * * * * * * * * * * * * * * * *

References and Links
[1] FIRAS Scientific Results. http://lambda.gsfc.nasa.gov/product/cobe/firas_image.cfm .
[2] Cosmic Microwave Background Anisotropy. http://www.astro.ucla.edu/~wright/CMB-DT.html .
[3] Spectrum Of The Cosmic Microwave Background. http://map.gsfc.nasa.gov/media/ContentMedia/990015b.jpg .
[4] Wien's displacement law. https://en.wikipedia.org/wiki/Wien%27s_displacement_law .
[5] Wien's Displacement Law. http://hyperphysics.phy-astr.gsu.edu/hbase/wien.html .
[6] Stefan-Boltzmann law. https://en.wikipedia.org/wiki/StefanÐBoltzmann_law .
[7] Black body. https://en.wikipedia.org/wiki/Black_body .
[8] Blackbody Radiation. http://astronomy.swin.edu.au/cosmos/B/Blackbody+Radiation .
[9] Planck's law. https://en.wikipedia.org/wiki/Planck%27s_law .
[10] Max Planck. https://en.wikipedia.org/wiki/Max_Planck .
[11] Galeria de mis Intelectos Predelictos. http://luisguillermo.com/intelectospredilectos/Planck.htm .
[12] Blackbody Radiation. http://hyperphysics.phy-astr.gsu.edu/hbase/bkg3k.html .
[13] Planck Mission. www.bbc.co.uk/science/space/universe/exploration/planck_mission/ .
[14] Comets. http://astro.hopkinsschools.org/course_documents/solar_system/icyworlds/comets/comets.htm .
[15] Oort Cloud. http://cse.ssl.berkeley.edu/segwayed/lessons/cometstale/glossary/glossary_6th_new/oort.html .
[16] Quantum. https://en.wikipedia.org/wiki/Quantum .
[17] Ejs Open source java applet Blackbody Radiation Spectrum Model for nm. http://www.phy.ntnu.edu.tw/ntnujava/index.php?topic=1037.msg3843#msg3843 .
[18] David Noel. Temperatures of the Earth -- a Globe in Space (a re-analysis with some surprising results). http://www.aoi.com.au/bcw/EarthTemp/ .
[19] The 3K Cosmic Background Radiation. hyperphysics.phy-astr.gsu.edu/hbase/bkg3k.html .
[20] Runaway Galaxy - Space Wallpaper. http://www.space.com/24956-galaxy-eso-137-001-space-wallpaper.html .
[21] Isaac Newton. https://en.wikipedia.org/wiki/Isaac_Newton .
[22]. Adam Rogers. General relativity and gravitational lensing: Part 2, Dark Matter. http://theamateurrealist.com/2014/08/27/general-relativity-and-gravitational-lensing-part-2-dark-matter/ .
[23] David Noel. Refining the Zwicky Constant. http://www.aoi.com.au/Zwicky/ .
[24] Outer Solar System. http://deepspaceexplorers.org/ .
[25] How Many Planets Are In Our Solar System? http://www.skyandtelescope.com/astronomy-resources/solar-system-planets-how-many-are-there/ .
[26] David Noel. The Cosmic Smog model for solar system formation, and the nature of 'Dark Matter'. http://www.aoi.com.au/bcw1/Cosmic/ .
[27] Paul Glister. Heliospheric Crossings (and the Consequences).
http://www.centauri-dreams.org/?p=9654 .
[28] Late Heavy Bombardment. http://en.wikipedia.org/wiki/Late_Heavy_Bombardment .
[29] Ring-a-Round the Saturn. http://www.nasa.gov/audience/forstudents/k-4/stories/nasa-knows/ring-a-round-the-saturn.html .
[30] Rogue planet. https://en.wikipedia.org/wiki/Rogue_planet .
[31] Discovery of the Cosmic Microwave background. http://map.gsfc.nasa.gov/universe/bb_tests_cmb.html .
[32] The Cosmic Microwave Background Radiation. http://www.amnh.org/education/resources/rfl/web/essaybooks/cosmic/cs_radiation.html .
[33] David Noel. The Oort Soup as the real origin of Cosmic Microwave Background Radiation. http://www.aoi.com.au/OortSoup/ .
[34] What is the temperature in the inner and outer Oort cloud? Are there planets there at least the size of Mars?
https://answers.yahoo.com/question/index?qid=20100125032140AAXWeAX .
[35] Why Sex Differences Don't Always Measure Up. https://sugarandslugs.wordpress.com/2011/02/13/sex-differences/ .
[36] Barry Evans. Serendipity in Science. http://www.northcoastjournal.com/humboldt/serendipity-in-science/Content?oid=2131243 .
[37] R.I.P. Expanding Universe (b. 1930, d. 2012): (The Big Bang never happened). http://www.aoi.com.au/bcw/RIPExpanding/ .
[38] Isaac Newton. Opticks. Fourth edition, 1730. Dover Books, 1952.
[39] Radiation Curves. http://hyperphysics.phy-astr.gsu.edu/hbase/bbrc.html#c2 .
[40] Cosmic Background Explorer. http://en.wikipedia.org/wiki/Cosmic_Background_Explorer .
[41] Terence Witt. Our Undiscovered Universe: Null Physics. Aridian Publishing, 2007.
[42] James Webb Space Telescope -- L2 Orbit. http://www.stsci.edu/jwst/overview/design/orbit .
[43] File:Cmbr.svg. https://commons.wikimedia.org/wiki/File:Cmbr.svg .
[44] Planetary temperatures. http://www.spaceacademy.net.au/library/notes/plantemp.htm .
[45] A Hot Jupiter for breakfast? http://www.astrojack.com/a-hot-jupiter-for-breakfast/ .
[46] Not a Dwarf: Is Pluto a Binary Planet? http://news.discovery.com/space/is-charon-a-moon-of-pluto-or-a-binary-planet-120715.htm .
[47] Red dwarf. https://en.wikipedia.org/wiki/Red_dwarf .
[48] David Noel. Inside The Earth -- The Heartfire Model. http://www.aoi.com.au/bcw/Heartfire/ .
[49] Olber's Paradox. http://www.crystalinks.com/olber's_paradox.html
[50] Bohr's Model of the Atom. http://chemistry.tutorvista.com/inorganic-chemistry/bohr-s-model-of-the-atom.html .
[51] Atomic Theory. https://shschemistry1.wikispaces.com/Atomic+Theory
[52] Edwin Hubble. https://en.wikipedia.org/wiki/Edwin_Hubble
[53] Niels Bohr. https://en.wikipedia.org/wiki/Niels_Bohr
Stablemate articles:
P0: -- The Overview article for the four COSMOLOGY PLUS articles:
P0: The Four Pillars of GAU: The Solar System and the Greater Averaged Universe.
P1: -- About the nature of matter between the stars:
The Cosmic Smog model for solar system formation, and the nature of 'Dark Matter'.
P2: -- About the origin of CMBR, Cosmic Microwave Background Radiation:
The Oort Soup as the real origin of Cosmic Microwave Background Radiation.
P3: -- How the microwave radiation from the Oort Soup opens up a new branch of Mid-IR astronomy:
Living In The Universe: (What CMBR tells us about Dark Matter, and much more).
P4: -- More about the Oort Soup, and how the Solar System fed from this in its billion-year history:
The Greater Averaged Universe (GAU) -- How the Solar System cannibalizes the Oort Cloud.
About the newer model of the Universe, superseding the Big Bang:
The Placid Universe Model -- Why the Universe is NOT Expanding, or, The real origin of CMBR, Cosmic Microwave Background Radiation.
About proving the Big Bang Theory is wrong:
R.I.P. Expanding Universe (b. 1930, d. 2012): (The Big Bang never happened).
About heat being generated within planets and small star-like objects,
expansion of the Earth, and formation of heavy elements:
Inside The Earth -- The Heartfire Model.
About the new and logical replacement for Hubble's Constant:
Refining the Zwicky Constant.
Go to the AOI Home Page
Draft Version 1.0, 2015 Sep 1-30.
First version 1.1 on Web, 2015 Oct 3.
V. 2.0 for COSMOLOGY PLUS part 3, 2016 Feb 24. V. 2.01, minor adjustment, 2016 Apr 14. V. 2.2, Adjusted. 2025 May 30. Uploaded 2025 Jun 6.
